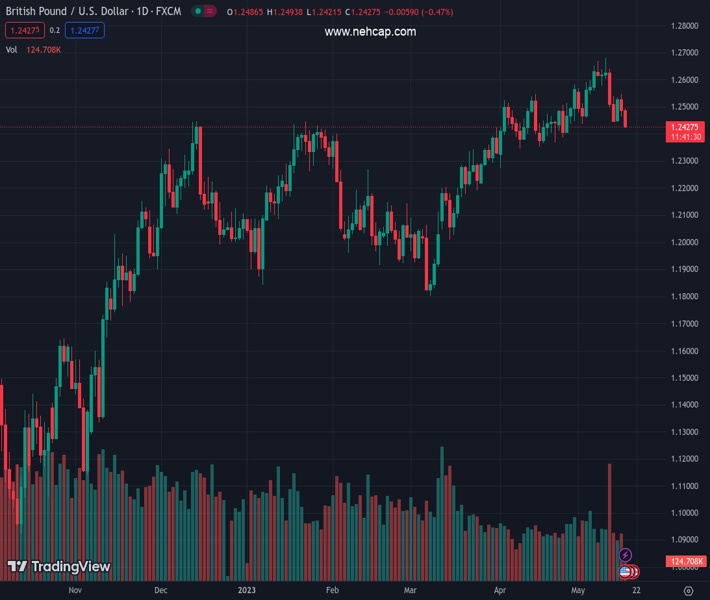
#GBPUSD @ 1.24252 drifts lower for the second straight day and dives to a three-week low on Wednesday. (Pivot Orderbook analysis)
…
This is a premium post.
[s2If !current_user_can(access_s2member_level4)]Please register for FREE REGISTER to read full post below containing analysis. In case of any error or you think you are not able to read the full post below, please email us at support#nehcap.com [lwa][/s2If] [s2If current_user_can(access_s2member_level1)]
- GBP/USD drifts lower for the second straight day and dives to a three-week low on Wednesday.
- Speculations for fewer BoE rate hikes undermine the GBP and weigh amid sustained USD buying.
- The fundamental/technical setup supports prospects for an extension of the downward trajectory.
The pair currently trades last at 1.24252.
The previous day high was 1.2547 while the previous day low was 1.2465. The daily 38.2% Fib levels comes at 1.2496, expected to provide resistance. Similarly, the daily 61.8% fib level is at 1.2516, expected to provide resistance.
The GBP/USD pair adds to the previous day’s losses and remains under heavy selling pressure for the second successive day on Wednesday. The downward trajectory remains uninterrupted through the first half of the European session and drags spot prices to a three-week low, around the 1.2420 region in the last hour.
The British Pound continues to be undermined by rather unimpressive UK monthly jobs data released on Tuesday, which fueled speculations that fewer rate increases by the Bank of England (BoE) will be needed in the coming months to bring down inflation. This, along with some follow-through US Dollar (USD) buying, aggravates the bearish pressure surrounding the GBP/USD pair and contributes to the steep intraday decline.
In fact, the USD Index (DXY), which tracks the Greenback against a basket of currencies, jumps to a nearly two-month high and draws support from a combination of factors. The overnight hawkish comments by Cleveland Federal Reserve (Fed) President Loretta Mester reaffirmed expectations that the US central bank will keep interest rates higher for longer. Apart from this, worries about a global economic slowdown benefits the safe-haven buck.
The softer Chinese macro data released on Tuesday pointed to a wobbly post-COVID recovery in the world’s second-largest economy and fueled recession fears. This comes on the back of a standoff to raise the federal government’s borrowing limit and drives some haven flows towards the Greenback. That said, a modest bounce in the US equity futures, along with a downtick in the US Treasury bond yields, might cap the USD.
Nevertheless, the aforementioned fundamental backdrop suggests that the path of least resistance for the GBP/USD pair is to the downside. Even from a technical perspective, last week’s breakdown through the lower end of over a one-month-old ascending trend channel favours bearish traders and supports prospects for a further near-term depreciating move towards the next relevant support near the 1.2375-1.2370 region.
Technical Levels: Supports and Resistances
GBPUSD currently trading at 1.2428 at the time of writing. Pair opened at 1.2489 and is trading with a change of -0.49 % .
| Overview | Overview.1 | |
|---|---|---|
| 0 | Today last price | 1.2428 |
| 1 | Today Daily Change | -0.0061 |
| 2 | Today Daily Change % | -0.4900 |
| 3 | Today daily open | 1.2489 |
The pair is trading below its 20 Daily moving average @ 1.2516, above its 50 Daily moving average @ 1.238 , above its 100 Daily moving average @ 1.2258 and above its 200 Daily moving average @ 1.1965
| Trends | Trends.1 | |
|---|---|---|
| 0 | Daily SMA20 | 1.2516 |
| 1 | Daily SMA50 | 1.2380 |
| 2 | Daily SMA100 | 1.2258 |
| 3 | Daily SMA200 | 1.1965 |
The previous day high was 1.2547 while the previous day low was 1.2465. The daily 38.2% Fib levels comes at 1.2496, expected to provide resistance. Similarly, the daily 61.8% fib level is at 1.2516, expected to provide resistance.
Note the levels of interest below:
- Pivot support is noted at 1.2454, 1.2419, 1.2373
- Pivot resistance is noted at 1.2535, 1.2582, 1.2617
| Levels | Levels.1 |
|---|---|
| Previous Daily High | 1.2547 |
| Previous Daily Low | 1.2465 |
| Previous Weekly High | 1.2680 |
| Previous Weekly Low | 1.2440 |
| Previous Monthly High | 1.2584 |
| Previous Monthly Low | 1.2275 |
| Daily Fibonacci 38.2% | 1.2496 |
| Daily Fibonacci 61.8% | 1.2516 |
| Daily Pivot Point S1 | 1.2454 |
| Daily Pivot Point S2 | 1.2419 |
| Daily Pivot Point S3 | 1.2373 |
| Daily Pivot Point R1 | 1.2535 |
| Daily Pivot Point R2 | 1.2582 |
| Daily Pivot Point R3 | 1.2617 |
[/s2If]
Nehcap Expert Advisor
The NEHCAP MT4 EA is high quality professional trading system geared to generate returns without using GRID or martingales. Each trade has strict risk per trade parameter. The pairs under management include EURUSD, GBPUSD, AUDCAD, AUDNZD,GBPAUD, EURAUD, EURCAD, CHFJPY and many more.
The system is trading live: LIVE ACCOUNT TRACKING
You can run it free. Apply for a free trial and track our account. Buy the system or use profit share mechanism to generate returns on your MT4.
Join Our Telegram Group
")


