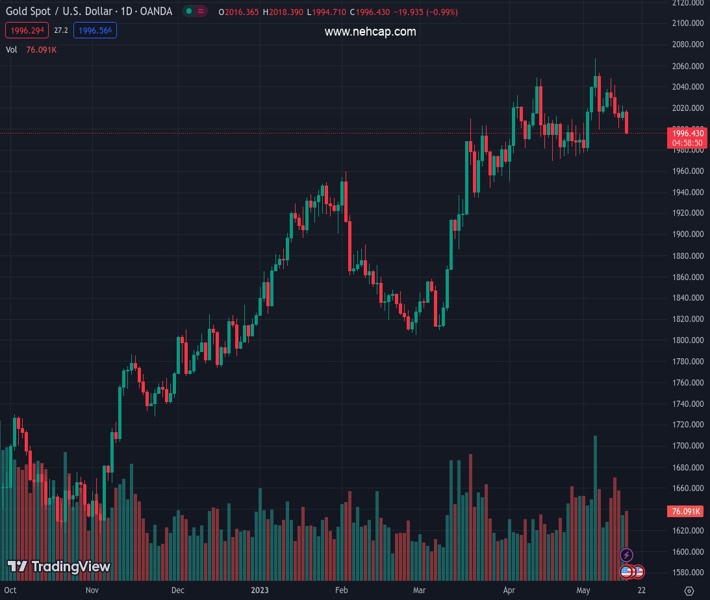
#XAUUSD @ 1,996.03 Gold prices fall 0.80% as US economic data showcases resilience, led by strong retail sales and industrial production figures. (Pivot Orderbook analysis)
…
This is a premium post.
[s2If !current_user_can(access_s2member_level4)]Please register for FREE REGISTER to read full post below containing analysis. In case of any error or you think you are not able to read the full post below, please email us at support#nehcap.com [lwa][/s2If] [s2If current_user_can(access_s2member_level1)]
- Gold prices fall 0.80% as US economic data showcases resilience, led by strong retail sales and industrial production figures.
- Hawkish tones from Fed officials Mester and Barkin contribute to rising US Treasury bond yields, further pressuring gold prices.
- Upcoming speeches from New York Fed John Williams, Dallas Fed Lorie Logan, and Atlanta’s Fed Raphael Bostic may provide more insight into the economic outlook.
The pair currently trades last at 1996.03.
The previous day high was 2022.18 while the previous day low was 2007.36. The daily 38.2% Fib levels comes at 2016.52, expected to provide resistance. Similarly, the daily 61.8% fib level is at 2013.02, expected to provide resistance.
Gold price is erasing Monday’s gains, plunging 0.80%, as data from the United States (US) showed signs of resilience amidst a solid retail sales report. Industrial Production recovered in April, though manufacturing production stood at contractionary territory. The factors mentioned above and the US bond yields rising were a headwind for XAU/USD prices. At the time of writing, the XAU/USD is trading at $2000.91 after hitting a daily high of $2018.28.
The US economic agenda revealed that Retail Sales rose by 0.4% MoM, below estimates of 0.8%, while excluding autos rose by 0.4% MoM, aligned with estimates. It should be said that both figures surpass March’s readings, which showed sales plunging. Annually based figures rose by 1.6% below the prior’s month 2.4% rise, suggesting an ongoing deceleration of the United States (US) economy.
In another data, the US Federal Reserve (Fed) reported that Industrial Production in April rose by 0.5% MoM, above estimates of 0%, while annually based, uptick to 0.2% from 0.1% in March. The same report showed that Manufacturing Production expanded at a 1% MoM pace, crushing forecasts of 0.1%, with motor vehicle production underpinning the figures.
On the data release, XAU/USD extended its losses and reached a two-day new low of $1998.17 before trimming some of its losses. US Treasury bond yields continued to rise as Federal Reserve officials led by San Francisco Fed President Loretta Mester and Richmond’s President Thomas Barkin sounded hawkish.
Mester said that the Fed cannot do much about slowing long-term economic growth but can “do its part” by tackling inflation. She emphasized the Fed’s commitment to getting inflation to the 2% target. In the meantime, Thomas Barkin said that if more increases are needed to bring down, he’s “comfortable with that.”
Further Fed speaking is expected with New York Fed John Williams, Dallas Fed Lorie Logan and Atlanta’s Fed Raphael Bostic.
XAU/USD remains in a neutral bias, albeit exchanging hands above the 50, 100, and 200-day Exponential Moving Averages (EMAs), each at $1978.42. Nevertheless, since reaching a year-to-date (YTD) high of $2081.82, XAU/USD retraced sharply, below the April 13 high of $2048.79, which opened the door for a deeper pullback. Since then, XAU/USD has fallen more than 3.5%, with sellers eyeing to extend its losses past the $2000 mark. Once cleared, the next support for XAU/USD would be the 50-day EMA at $1978.43 before Gold tests the April 19 swing low of $1969.34.
Technical Levels: Supports and Resistances
XAUUSD currently trading at 2001.34 at the time of writing. Pair opened at 2016.46 and is trading with a change of -0.75 % .
| Overview | Overview.1 | |
|---|---|---|
| 0 | Today last price | 2001.34 |
| 1 | Today Daily Change | -15.12 |
| 2 | Today Daily Change % | -0.75 |
| 3 | Today daily open | 2016.46 |
The pair is trading below its 20 Daily moving average @ 2008.72, above its 50 Daily moving average @ 1975.65 , above its 100 Daily moving average @ 1922.14 and above its 200 Daily moving average @ 1822.15
| Trends | Trends.1 | |
|---|---|---|
| 0 | Daily SMA20 | 2008.72 |
| 1 | Daily SMA50 | 1975.65 |
| 2 | Daily SMA100 | 1922.14 |
| 3 | Daily SMA200 | 1822.15 |
The previous day high was 2022.18 while the previous day low was 2007.36. The daily 38.2% Fib levels comes at 2016.52, expected to provide resistance. Similarly, the daily 61.8% fib level is at 2013.02, expected to provide resistance.
Note the levels of interest below:
- Pivot support is noted at 2008.49, 2000.51, 1993.67
- Pivot resistance is noted at 2023.31, 2030.15, 2038.13
| Levels | Levels.1 |
|---|---|
| Previous Daily High | 2022.18 |
| Previous Daily Low | 2007.36 |
| Previous Weekly High | 2048.27 |
| Previous Weekly Low | 2000.95 |
| Previous Monthly High | 2048.75 |
| Previous Monthly Low | 1949.83 |
| Daily Fibonacci 38.2% | 2016.52 |
| Daily Fibonacci 61.8% | 2013.02 |
| Daily Pivot Point S1 | 2008.49 |
| Daily Pivot Point S2 | 2000.51 |
| Daily Pivot Point S3 | 1993.67 |
| Daily Pivot Point R1 | 2023.31 |
| Daily Pivot Point R2 | 2030.15 |
| Daily Pivot Point R3 | 2038.13 |
[/s2If]
Nehcap Expert Advisor
The NEHCAP MT4 EA is high quality professional trading system geared to generate returns without using GRID or martingales. Each trade has strict risk per trade parameter. The pairs under management include EURUSD, GBPUSD, AUDCAD, AUDNZD,GBPAUD, EURAUD, EURCAD, CHFJPY and many more.
The system is trading live: LIVE ACCOUNT TRACKING
You can run it free. Apply for a free trial and track our account. Buy the system or use profit share mechanism to generate returns on your MT4.
Join Our Telegram Group


