#EURUSD @ 1.08623 stays in negative territory, down 0.06%, as solid US economic data triggers a jump in US Treasury bond yields and strengthens the US Dollar. (Pivot Orderbook analysis)
…
This is a premium post.
[s2If !current_user_can(access_s2member_level4)]Please register for FREE REGISTER to read full post below containing analysis. In case of any error or you think you are not able to read the full post below, please email us at support#nehcap.com [lwa][/s2If] [s2If current_user_can(access_s2member_level1)]
- EUR/USD stays in negative territory, down 0.06%, as solid US economic data triggers a jump in US Treasury bond yields and strengthens the US Dollar.
- Eurozone data largely aligned with estimates, while ZEW Economic Sentiment Index dropped sharply, reflecting increasing recession fears in the bloc.
- Upcoming speeches from regional Fed Presidents could provide further insight into US monetary policy, with some officials stating it’s too early to discuss rate cuts.
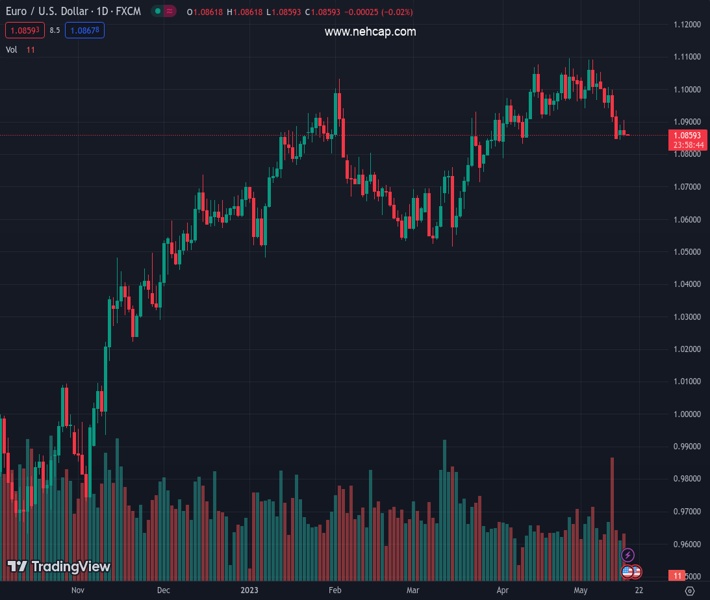
The pair currently trades last at 1.08623.
The previous day high was 1.0891 while the previous day low was 1.0845. The daily 38.2% Fib levels comes at 1.0873, expected to provide resistance. Similarly, the daily 61.8% fib level is at 1.0863, expected to provide resistance.
EUR/USD trims some of its earlier losses though it remains in negative territory, sponsored by solid economic data from the United States (US), triggering a jump in US Treasury bond yields. Therefore, the US Dollar (USD) rose, helped by US bond yields, while Eurozone’s (EU) data was aligned with estimates. The EUR/USD is trading at 1.0868, down 0.06%.
US equities are slightly mixed, except for the Nasdaq 100. US Retail Sales for April improved, with some figures missing estimates, but overall, the month-over-month (MoM) numbers beat March’s data, except for Retail Sales on an annual basis. Later, the US Federal Reserve (Fed) reported that Industrial Production for April rose by 0.5% MoM, above estimates, while year-over-year (YoY) stood at 0.2% above March’s 0.1%.
Although the EUR/USD’s initial reaction headed towards 1.0880s, overall US Dollar strength dragged the exchange rates toward the day’s lows at 1.0855. The US Dollar Index (DXY), a gauge of the buck’s value against a basket of six currencies, trimmed some of Monday’s losses, edging up 0.17% at 102.597.
The EU’s agenda revealed the Balance of Trader printed a surplus of 25.6 billion of Euro’s, above the prior’s month 4.6 Billion. Furthermore, the Gross Domestic Product (GDP) for Q1 was aligned with estimates at 1.3%, while the Employment Change QoQ rose 0.6% in Q1. The ZEW Economic Sentiment Index plunged to -9.4 as recession fears mount, despite the ongoing tightening cycle by the European Central Bank (ECB).
Aside from this, US debt ceiling discussions finished in the White House, and initial reports prompted that US Congress leaders agreed that a deal is possible by the end of the week while emphasizing that a default “is a horrible option.”
Late Fed speakers like Aaron Golsbee and Lorie Logan, Presidents of the Chicago and Dallas Fed Regional Banks, commented that it’s early to discuss interest rate cuts. Logan added that when conditions are uncertain, the Fed may need to move more slowly and added that we need to move slowly.
Technical Levels: Supports and Resistances
EURUSD currently trading at 1.0862 at the time of writing. Pair opened at 1.0874 and is trading with a change of -0.11 % .
| Overview | Overview.1 | |
|---|---|---|
| 0 | Today last price | 1.0862 |
| 1 | Today Daily Change | -0.0012 |
| 2 | Today Daily Change % | -0.1100 |
| 3 | Today daily open | 1.0874 |
The pair is trading below its 20 Daily moving average @ 1.0983, below its 50 Daily moving average @ 1.0875 , above its 100 Daily moving average @ 1.0801 and above its 200 Daily moving average @ 1.0456
| Trends | Trends.1 | |
|---|---|---|
| 0 | Daily SMA20 | 1.0983 |
| 1 | Daily SMA50 | 1.0875 |
| 2 | Daily SMA100 | 1.0801 |
| 3 | Daily SMA200 | 1.0456 |
The previous day high was 1.0891 while the previous day low was 1.0845. The daily 38.2% Fib levels comes at 1.0873, expected to provide resistance. Similarly, the daily 61.8% fib level is at 1.0863, expected to provide resistance.
Note the levels of interest below:
- Pivot support is noted at 1.085, 1.0825, 1.0804
- Pivot resistance is noted at 1.0895, 1.0916, 1.0941
| Levels | Levels.1 |
|---|---|
| Previous Daily High | 1.0891 |
| Previous Daily Low | 1.0845 |
| Previous Weekly High | 1.1054 |
| Previous Weekly Low | 1.0848 |
| Previous Monthly High | 1.1095 |
| Previous Monthly Low | 1.0788 |
| Daily Fibonacci 38.2% | 1.0873 |
| Daily Fibonacci 61.8% | 1.0863 |
| Daily Pivot Point S1 | 1.0850 |
| Daily Pivot Point S2 | 1.0825 |
| Daily Pivot Point S3 | 1.0804 |
| Daily Pivot Point R1 | 1.0895 |
| Daily Pivot Point R2 | 1.0916 |
| Daily Pivot Point R3 | 1.0941 |
[/s2If]
Nehcap Expert Advisor
The NEHCAP MT4 EA is high quality professional trading system geared to generate returns without using GRID or martingales. Each trade has strict risk per trade parameter. The pairs under management include EURUSD, GBPUSD, AUDCAD, AUDNZD,GBPAUD, EURAUD, EURCAD, CHFJPY and many more.
The system is trading live: LIVE ACCOUNT TRACKING
You can run it free. Apply for a free trial and track our account. Buy the system or use profit share mechanism to generate returns on your MT4.
Join Our Telegram Group


