#USDINR @ 82.2000 retreats after refreshing three-week high, prods two-day winning streak., @nehcap view: Further upside expected (Pivot Orderbook analysis)
…
This is a premium post.
[s2If !current_user_can(access_s2member_level4)]Please register for FREE REGISTER to read full post below containing analysis. In case of any error or you think you are not able to read the full post below, please email us at support#nehcap.com [lwa][/s2If] [s2If current_user_can(access_s2member_level1)]
- USD/INR retreats after refreshing three-week high, prods two-day winning streak.
- Upbeat oscillators, sustained break of 100-DMA favors Indian Rupee bears.
- 61.8% Fibonacci retracement, six-week-old descending resistance line restrict immediate upside.
- USD/INR buyers remain hopeful above 200-DMA; two-month-old previous resistance line adds to the downside filters.
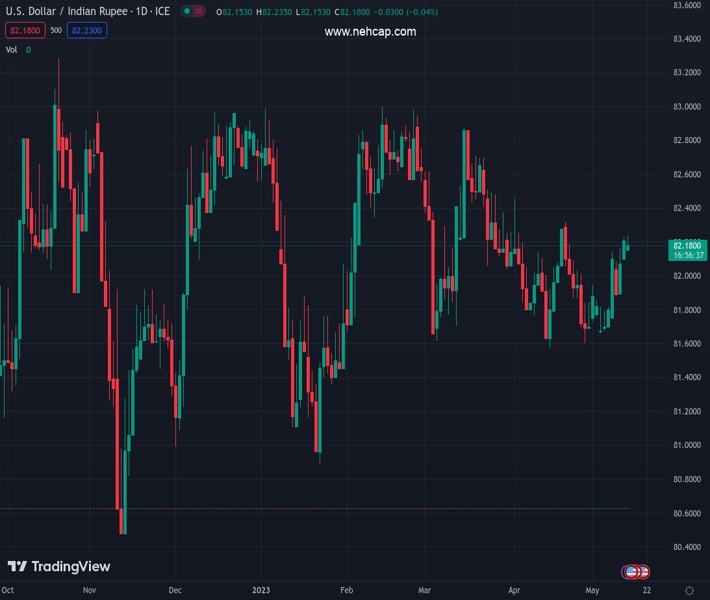
The pair currently trades last at 82.2000.
The previous day high was 82.2658 while the previous day low was 82.088. The daily 38.2% Fib levels comes at 82.1979, expected to provide support. Similarly, the daily 61.8% fib level is at 82.1559, expected to provide support.
USD/INR remains mildly offered near 82.20 as it retreats from the highest levels in three weeks during early Monday. In doing so, the Indian Rupee pair fails to justify the previous day’s upside break of the 100-DMA as the 61.8% Fibonacci retracement level of its October-November downside.
Even so, the bullish MACD signals and upbeat RSI (14) line, not overbought, keep the USD/INR pair buyers hopeful of witnessing a daily closing beyond the aforementioned key Fibonacci retracement level of 82.25.
However, a downward-sloping resistance line from April 03, close to 82.30 can act as an extra filter towards the north.
In a case where the USD/INR bulls manage to keep the reins past 82.30, the tops marked during April around 82.40 and 82.50 could lure the pair buyers.
Following that, the yearly high marked in March around 83.05 will be in the spotlight.
Alternatively, a daily closing below the 100-DMA level of around 82.15 isn’t an open invitation to the USD/INR bears as the resistance-turned-support line from mid-March, around the 82.00 round figure, could challenge the Indian Rupee buyers.
Though, the pair sellers should remain cautious unless witnessing a daily closing below the 200-DMA support of around 81.70.
Trend: Further upside expected
Technical Levels: Supports and Resistances
USDINR currently trading at 82.2023 at the time of writing. Pair opened at 82.2563 and is trading with a change of -0.07% % .
| Overview | Overview.1 | |
|---|---|---|
| 0 | Today last price | 82.2023 |
| 1 | Today Daily Change | -0.0540 |
| 2 | Today Daily Change % | -0.07% |
| 3 | Today daily open | 82.2563 |
The pair remains strongly bullish on the daily timeframe. It trades above its 20 SMA @ 81.9327, 50 SMA 82.0772, 100 SMA @ 82.1528 and 200 SMA @ 81.7013.
| Trends | Trends.1 | |
|---|---|---|
| 0 | Daily SMA20 | 81.9327 |
| 1 | Daily SMA50 | 82.0772 |
| 2 | Daily SMA100 | 82.1528 |
| 3 | Daily SMA200 | 81.7013 |
The previous day high was 82.2658 while the previous day low was 82.088. The daily 38.2% Fib levels comes at 82.1979, expected to provide support. Similarly, the daily 61.8% fib level is at 82.1559, expected to provide support.
Note the levels of interest below:
- Pivot support is noted at 82.1409, 82.0255, 81.9631
- Pivot resistance is noted at 82.3188, 82.3812, 82.4966
| Levels | Levels.1 |
|---|---|
| Previous Daily High | 82.2658 |
| Previous Daily Low | 82.0880 |
| Previous Weekly High | 82.2658 |
| Previous Weekly Low | 81.6690 |
| Previous Monthly High | 82.5092 |
| Previous Monthly Low | 81.4850 |
| Daily Fibonacci 38.2% | 82.1979 |
| Daily Fibonacci 61.8% | 82.1559 |
| Daily Pivot Point S1 | 82.1409 |
| Daily Pivot Point S2 | 82.0255 |
| Daily Pivot Point S3 | 81.9631 |
| Daily Pivot Point R1 | 82.3188 |
| Daily Pivot Point R2 | 82.3812 |
| Daily Pivot Point R3 | 82.4966 |
[/s2If]
Nehcap Expert Advisor
The NEHCAP MT4 EA is high quality professional trading system geared to generate returns without using GRID or martingales. Each trade has strict risk per trade parameter. The pairs under management include EURUSD, GBPUSD, AUDCAD, AUDNZD,GBPAUD, EURAUD, EURCAD, CHFJPY and many more.
The system is trading live: LIVE ACCOUNT TRACKING
You can run it free. Apply for a free trial and track our account. Buy the system or use profit share mechanism to generate returns on your MT4.
Join Our Telegram Group


