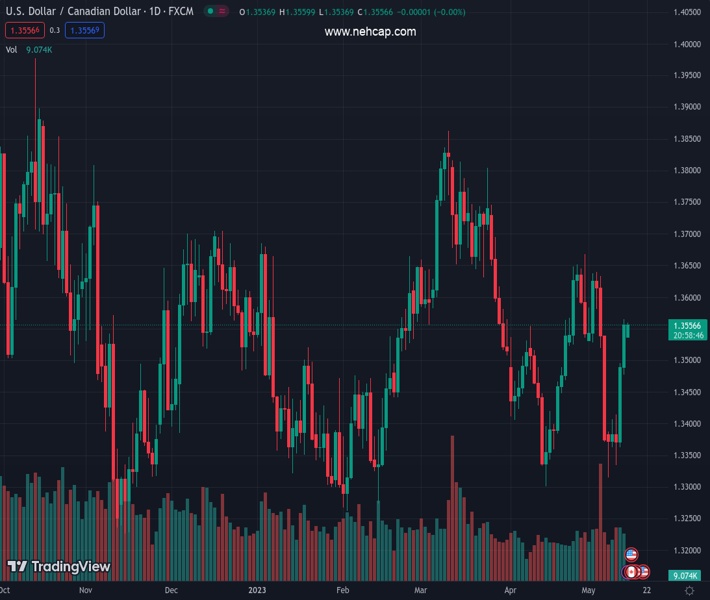
#USDCAD @ 1.35480 remains firmer around one-week high after a hefty run-up in the last two days. (Pivot Orderbook analysis)
…
This is a premium post.
[s2If !current_user_can(access_s2member_level4)]Please register for FREE REGISTER to read full post below containing analysis. In case of any error or you think you are not able to read the full post below, please email us at support#nehcap.com [lwa][/s2If] [s2If current_user_can(access_s2member_level1)]
- USD/CAD remains firmer around one-week high after a hefty run-up in the last two days.
- WTI crude oil drops below $70.00 for the first time in over a week amid risk-off mood, firmer US Dollar.
- Fears emanating from US debt ceiling talks, banking sector woes weigh on Oil price, favor US Dollar.
- Canada inflation data, US Retail Sales and Fed Chair Powell’s speech should also be eyed for clear directions.
The pair currently trades last at 1.35480.
The previous day high was 1.3565 while the previous day low was 1.348. The daily 38.2% Fib levels comes at 1.3533, expected to provide support. Similarly, the daily 61.8% fib level is at 1.3512, expected to provide support.
USD/CAD bulls keep the reins at the highest levels in eight days, flirting with 1.3550 amid Monday’s Asian session. In doing so, the Loonie pair buyers not only cheers the US Dollar’s run-up but also benefit from the latest slump in the Oil price, Canada’s key export item. It should be noted, however, that the cautious mood ahead of this week’s Canada inflation and US Retail Sales for April keeps the major currency pair traders on the sideline, especially amid US debt ceiling woes.
US Dollar Index (DXY) makes rounds to the highest levels in five weeks as fears of US default join the banking sector jitters to underpin the US Dollar’s haven demand. In doing so, the greenback’s gauge versus the six major currencies ignores softer US data and mixed Fed talks.
That said, the preliminary readings of the University of Michigan’s (UoM) Consumer Confidence Index for May dropped to 57.7 from 63.5 prior versus 63.0 market forecasts. More interestingly, the one-year inflation expectations dropped from 4.6% to 4.5% for the said month but 5-year counterpart rose to the highest reading since 2011, from 3.0% to 3.2%.
Even so, Fed Governor Philip Jefferson and St. Louis Fed President James Bullard defend the US central bank’s current monetary policy while citing higher inflation as a major challenge.
On the other hand, US President Joe Biden signaled that Friday’s delayed talks will be held on Tuesday, which in turn might have allowed the USD/CAD to take a breather. However, the policymakers are still at loggerheads and hence a positive outcome isn’t widely expected, which in turn keeps the Loonie pair on the bull’s table.
Elsewhere, WTI crude oil remains depressed near $69.90 after falling in the last three consecutive days. The black gold bears the burden of the latest economic jitters, as well as hopes of higher Oil output from Canada as Alberta resumes Oil production after halting it due to the geopolitical problems the last week.
Against this backdrop, Wall Street closed with losses and the US Treasury bond yields managed to remain firmer while the S&P 500 Futures remain pressured, which in turn fueled the USD/CAD prices.
Moving on, Canada Wholesale Sales, Housing Starts and the US NY Empire State Manufacturing Index will decorate Monday’s economic calendar and should be watched for immediate directions. However, major attention should be given to the US debt ceiling updates, US Retail Sales and a speech from Fed Chairman Jerome Powell.
A daily closing beyond the 100-DMA, around 1.3515 by the press time, directs USD/CAD bulls toward a two-month-old descending resistance line, close to 1.3590 at the latest.
Technical Levels: Supports and Resistances
USDCAD currently trading at 1.3558 at the time of writing. Pair opened at 1.3552 and is trading with a change of 0.04% % .
| Overview | Overview.1 | |
|---|---|---|
| 0 | Today last price | 1.3558 |
| 1 | Today Daily Change | 0.0006 |
| 2 | Today Daily Change % | 0.04% |
| 3 | Today daily open | 1.3552 |
The pair is trading above its 20 Daily moving average @ 1.3504, below its 50 Daily moving average @ 1.3569 , above its 100 Daily moving average @ 1.3514 and above its 200 Daily moving average @ 1.346
| Trends | Trends.1 | |
|---|---|---|
| 0 | Daily SMA20 | 1.3504 |
| 1 | Daily SMA50 | 1.3569 |
| 2 | Daily SMA100 | 1.3514 |
| 3 | Daily SMA200 | 1.3460 |
The previous day high was 1.3565 while the previous day low was 1.348. The daily 38.2% Fib levels comes at 1.3533, expected to provide support. Similarly, the daily 61.8% fib level is at 1.3512, expected to provide support.
Note the levels of interest below:
- Pivot support is noted at 1.3499, 1.3447, 1.3414
- Pivot resistance is noted at 1.3585, 1.3618, 1.367
| Levels | Levels.1 |
|---|---|
| Previous Daily High | 1.3565 |
| Previous Daily Low | 1.3480 |
| Previous Weekly High | 1.3565 |
| Previous Weekly Low | 1.3315 |
| Previous Monthly High | 1.3668 |
| Previous Monthly Low | 1.3301 |
| Daily Fibonacci 38.2% | 1.3533 |
| Daily Fibonacci 61.8% | 1.3512 |
| Daily Pivot Point S1 | 1.3499 |
| Daily Pivot Point S2 | 1.3447 |
| Daily Pivot Point S3 | 1.3414 |
| Daily Pivot Point R1 | 1.3585 |
| Daily Pivot Point R2 | 1.3618 |
| Daily Pivot Point R3 | 1.3670 |
[/s2If]
Nehcap Expert Advisor
The NEHCAP MT4 EA is high quality professional trading system geared to generate returns without using GRID or martingales. Each trade has strict risk per trade parameter. The pairs under management include EURUSD, GBPUSD, AUDCAD, AUDNZD,GBPAUD, EURAUD, EURCAD, CHFJPY and many more.
The system is trading live: LIVE ACCOUNT TRACKING
You can run it free. Apply for a free trial and track our account. Buy the system or use profit share mechanism to generate returns on your MT4.
Join Our Telegram Group
")


