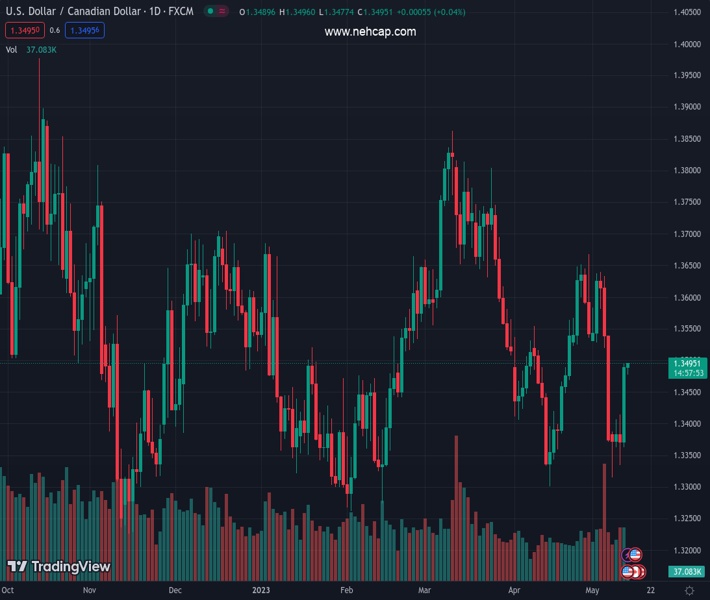
#USDCAD @ 1.34896 clings to mild losses near one-week high after rising the most on a day since early March. (Pivot Orderbook analysis)
…
This is a premium post.
[s2If !current_user_can(access_s2member_level4)]Please register for FREE REGISTER to read full post below containing analysis. In case of any error or you think you are not able to read the full post below, please email us at support#nehcap.com [lwa][/s2If] [s2If current_user_can(access_s2member_level1)]
- USD/CAD clings to mild losses near one-week high after rising the most on a day since early March.
- Downbeat Oil price, firmer US Dollar previously favored Loonie pair buyers amid risk-off mood.
- Market’s consolidation fails to inspire USD/CAD bears as WTI crude oil remains downbeat.
- US inflation clues, debt ceiling updates and banking news eyed for clear directions.
The pair currently trades last at 1.34896.
The previous day high was 1.3496 while the previous day low was 1.3363. The daily 38.2% Fib levels comes at 1.3445, expected to provide support. Similarly, the daily 61.8% fib level is at 1.3414, expected to provide support.
USD/CAD bulls take a breather around 1.3490 amid early Friday, after posting the biggest daily jump in nine weeks the previous day. In doing so, the Loonie pair fails to cheer the US Dollar’s retreat as the Oil price remains bearish. Also keeping the buyers hopeful is the cautious mood ahead of the US inflation clues, as well as challenges to sentiment emanating from the US debt ceiling talks and banking fallouts.
WTI crude oil price remains pressured at the weekly low, near $70.60 by the press time, down for the third consecutive day as economic fears join the firmer US Dollar to weigh on the commodity prices. That said, recently downbeat inflation data from China, the world’s biggest commodity user, join the looming fears of US default and banking fallouts to exert downside pressure on the black gold prices.
On the other hand, the US Dollar Index (DXY) retreats from a one-week high to 102.00 after posting the biggest daily gains in two months the previous day despite mostly downbeat prints of the US Producer Price Index (PPI) and Initial Jobless Claims. It should be noted that the hawkish comments from Minneapolis Fed President Neel Kashkari joined the postponement of the debt ceiling talks between US President Joe Biden and House Speaker McCarthy and a slump in the share price of PacWest Bancorp to favor the US Dollar bulls.
Elsewhere, expectations of recovery in China inflation data and hopes of witnessing softer US inflation clues join an absence of fresh disappointment from the US banking, debt-ceiling front to underpin the market’s latest corrective bounce.
While portraying the mood, the US stock futures print mild gains while the Asia-Pacific equities grind higher amid downbeat US Treasury bond yields.
Looking ahead, a light calendar in Canada allows the USD/CAD traders to concentrate on preliminary readings of the University of Michigan’s (UoM) Consumer Sentiment Index (CSI) for May, as well as the UoM 5-year Consumer Inflation Expectations for the said month, for possible moves.
Despite the previous day’s run-up, USD/CAD stays on the bear’s radar unless providing a daily closing beyond the 100-DMA hurdle of around 1.3520.
Technical Levels: Supports and Resistances
USDCAD currently trading at 1.3487 at the time of writing. Pair opened at 1.3492 and is trading with a change of -0.04% % .
| Overview | Overview.1 | |
|---|---|---|
| 0 | Today last price | 1.3487 |
| 1 | Today Daily Change | -0.0005 |
| 2 | Today Daily Change % | -0.04% |
| 3 | Today daily open | 1.3492 |
The pair is trading below its 20 Daily moving average @ 1.3495, below its 50 Daily moving average @ 1.357 , below its 100 Daily moving average @ 1.3515 and above its 200 Daily moving average @ 1.3457
| Trends | Trends.1 | |
|---|---|---|
| 0 | Daily SMA20 | 1.3495 |
| 1 | Daily SMA50 | 1.3570 |
| 2 | Daily SMA100 | 1.3515 |
| 3 | Daily SMA200 | 1.3457 |
The previous day high was 1.3496 while the previous day low was 1.3363. The daily 38.2% Fib levels comes at 1.3445, expected to provide support. Similarly, the daily 61.8% fib level is at 1.3414, expected to provide support.
Note the levels of interest below:
- Pivot support is noted at 1.3405, 1.3318, 1.3273
- Pivot resistance is noted at 1.3537, 1.3583, 1.367
| Levels | Levels.1 |
|---|---|
| Previous Daily High | 1.3496 |
| Previous Daily Low | 1.3363 |
| Previous Weekly High | 1.3639 |
| Previous Weekly Low | 1.3371 |
| Previous Monthly High | 1.3668 |
| Previous Monthly Low | 1.3301 |
| Daily Fibonacci 38.2% | 1.3445 |
| Daily Fibonacci 61.8% | 1.3414 |
| Daily Pivot Point S1 | 1.3405 |
| Daily Pivot Point S2 | 1.3318 |
| Daily Pivot Point S3 | 1.3273 |
| Daily Pivot Point R1 | 1.3537 |
| Daily Pivot Point R2 | 1.3583 |
| Daily Pivot Point R3 | 1.3670 |
[/s2If]
Nehcap Expert Advisor
The NEHCAP MT4 EA is high quality professional trading system geared to generate returns without using GRID or martingales. Each trade has strict risk per trade parameter. The pairs under management include EURUSD, GBPUSD, AUDCAD, AUDNZD,GBPAUD, EURAUD, EURCAD, CHFJPY and many more.
The system is trading live: LIVE ACCOUNT TRACKING
You can run it free. Apply for a free trial and track our account. Buy the system or use profit share mechanism to generate returns on your MT4.
Join Our Telegram Group
")


