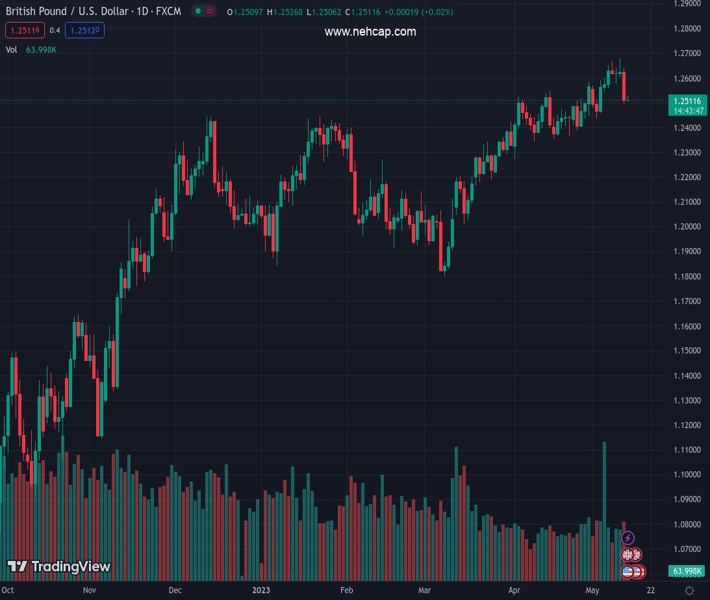
#GBPUSD @ 1.25095 picks up bids to pare BoE induced losses after upbeat UK growth, activity data. (Pivot Orderbook analysis)
…
This is a premium post.
[s2If !current_user_can(access_s2member_level4)]Please register for FREE REGISTER to read full post below containing analysis. In case of any error or you think you are not able to read the full post below, please email us at support#nehcap.com [lwa][/s2If] [s2If current_user_can(access_s2member_level1)]
- GBP/USD picks up bids to pare BoE induced losses after upbeat UK growth, activity data.
- UK Q1 GDP matches downbeat market forecasts on QoQ and YoY basis, per preliminary estimations.
- US Dollar consolidates Thursday’s gains ahead more inflation clues.
- Hopes of avoiding US default, absence of major disappointment from banks favor corrective pullback.
The pair currently trades last at 1.25095.
The previous day high was 1.2641 while the previous day low was 1.2497. The daily 38.2% Fib levels comes at 1.2552, expected to provide resistance. Similarly, the daily 61.8% fib level is at 1.2586, expected to provide resistance.
GBP/USD takes offers to renew intraday low near 1.2500 as it bears the burden of the disappointing UK data heading into Friday’s London open. In doing so, the Cable pair fails to cheer the US Dollar’s consolidation of the biggest daily jump in two months ahead of the key US data. It’s worth noting, however, that the US inflation clues and risk catalysts are still capable of recalling the Cable bears.
That said, the preliminary readings of the UK’s first quarter (Q1) Gross Domestic Product (GDP) mark 0.1% QoQ growth versus 0.1% expected and prior readouts. That said, the monthly GDP for March, however, dropped -0.3% compared to 0.0% market forecasts and previous readings. Further, the British Manufacturing and Industrial Production details for March marked mixed outcomes.
Also read: UK Preliminary GDP expands 0.1% QoQ in Q1 2023, as expected
Due to the mostly downbeat British data, the US Dollar Index (DXY) retreat from the weekly high to 102.00 by the press time fails to put a floor under the Cable pair. That said, the greenback’s gauge versus the six major currencies marked the biggest daily gains in two months the previous day. However, expectations of recovery in China’s inflation data and hopes of witnessing softer US inflation clues join an absence of fresh disappointment from the US banking, debt-ceiling front to underpin the DXY’s latest corrective pullback.
It’s worth noting that the latest easing in the UK data joins the Bank of England (BoE) Governor Andrew Bailey’s hopes of witnessing a sharp fall in inflation to weigh on the GBP/USD prices.
Looking forward, the first readings of the University of Michigan’s (UoM) Consumer Sentiment Index (CSI) for May, as well as the UoM 5-year Consumer Inflation Expectations for the said month, will also be important to watch for clear directions. Should the US inflation precursors match downbeat forecasts, the GBP/USD may have another chance to rebound, given the risk appetite remains even.
Unless providing a daily closing beyond a two-month-old previous support line, around 1.2540 by the press time, the GBP/USD buyers remain off the table. The Cable pair’s fresh selling needs validation from an upward-sloping trend line from late March, around 1.2500 round figure at the latest.
Technical Levels: Supports and Resistances
GBPUSD currently trading at 1.2518 at the time of writing. Pair opened at 1.2511 and is trading with a change of 0.06% % .
| Overview | Overview.1 | |
|---|---|---|
| 0 | Today last price | 1.2518 |
| 1 | Today Daily Change | 0.0007 |
| 2 | Today Daily Change % | 0.06% |
| 3 | Today daily open | 1.2511 |
The pair remains strongly bullish on the daily timeframe. It trades above its 20 SMA @ 1.2504, 50 SMA 1.2349, 100 SMA @ 1.2245 and 200 SMA @ 1.1959.
| Trends | Trends.1 | |
|---|---|---|
| 0 | Daily SMA20 | 1.2504 |
| 1 | Daily SMA50 | 1.2349 |
| 2 | Daily SMA100 | 1.2245 |
| 3 | Daily SMA200 | 1.1959 |
The previous day high was 1.2641 while the previous day low was 1.2497. The daily 38.2% Fib levels comes at 1.2552, expected to provide resistance. Similarly, the daily 61.8% fib level is at 1.2586, expected to provide resistance.
Note the levels of interest below:
- Pivot support is noted at 1.2458, 1.2406, 1.2314
- Pivot resistance is noted at 1.2602, 1.2694, 1.2746
| Levels | Levels.1 |
|---|---|
| Previous Daily High | 1.2641 |
| Previous Daily Low | 1.2497 |
| Previous Weekly High | 1.2652 |
| Previous Weekly Low | 1.2436 |
| Previous Monthly High | 1.2584 |
| Previous Monthly Low | 1.2275 |
| Daily Fibonacci 38.2% | 1.2552 |
| Daily Fibonacci 61.8% | 1.2586 |
| Daily Pivot Point S1 | 1.2458 |
| Daily Pivot Point S2 | 1.2406 |
| Daily Pivot Point S3 | 1.2314 |
| Daily Pivot Point R1 | 1.2602 |
| Daily Pivot Point R2 | 1.2694 |
| Daily Pivot Point R3 | 1.2746 |
[/s2If]
Nehcap Expert Advisor
The NEHCAP MT4 EA is high quality professional trading system geared to generate returns without using GRID or martingales. Each trade has strict risk per trade parameter. The pairs under management include EURUSD, GBPUSD, AUDCAD, AUDNZD,GBPAUD, EURAUD, EURCAD, CHFJPY and many more.
The system is trading live: LIVE ACCOUNT TRACKING
You can run it free. Apply for a free trial and track our account. Buy the system or use profit share mechanism to generate returns on your MT4.
Join Our Telegram Group
")


