#USDINR @ 81.5500 remains pressured at 11-week low, down for the third consecutive day., @nehcap view: Limited downside expected (Pivot Orderbook analysis)
…
This is a premium post.
[s2If !current_user_can(access_s2member_level4)]Please register for PREMIUM VERSION HERE to read full post below containing analysis. In case of any error or you think you are not able to read the full post below, please email us at support#nehcap.com [lwa][/s2If] [s2If current_user_can(access_s2member_level4)]
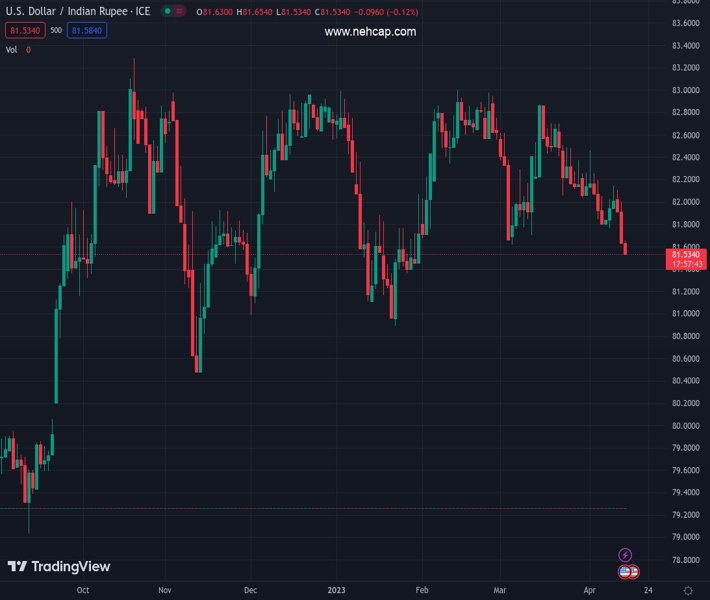
- USD/INR remains pressured at 11-week low, down for the third consecutive day.
- Clear downside break of ascending trend line from late January, bearish MACD signals favor Indian Rupee (INR) buyers.
- Convergence of 200-DMA, five-month-old rising support line restricts immediate downside of USD/INR.
- Indian Rupee sellers remain off the table below 82.10.
The pair currently trades last at 81.5500.
The previous day high was 82.16 while the previous day low was 81.63. The daily 38.2% Fib levels comes at 81.8325, expected to provide resistance. Similarly, the daily 61.8% fib level is at 81.9576, expected to provide resistance.
USD/INR clings to mild losses around 81.60 during early Friday, after falling to the lowest levels since late January before a few minutes.
In doing so, the Indian Rupee (INR) pair justifies the previous day’s downside break of an upward-sloping support line from January 23, now resistance. Adding strength to the bearish bias are the downbeat MACD signals.
However, the RSI (14) line is approaching the oversold territory and signals bottom picking of the USD/INR prices, which in turn highlights the 81.45 support confluence as the key for the USD/INR bears to watch. That said, the stated level encompasses the 200-DMA and an ascending trend line from November 2022.
If at all the USD/INR bears dominate past 81.45 and offer a daily closing below the same, the November 2022 low near 81.00 and the yearly trough surrounding 80.90 will be in the spotlight.
Meanwhile, recovery remains elusive unless the Indian Rupee pair remains below the support-turned-resistance line stretched from January, close to 81.95 by the press time.
Even if the USD/INR buyers manage to cross the 81.95 hurdle, the 82.00 round figure and a three-week-old descending resistance line, close to 82.10 at the latest, will be crucial challenges for them to conquer.
Trend: Limited downside expected
Technical Levels: Supports and Resistances
USDINR currently trading at 81.585 at the time of writing. Pair opened at 81.682 and is trading with a change of -0.12% % .
| Overview | Overview.1 | |
|---|---|---|
| 0 | Today last price | 81.585 |
| 1 | Today Daily Change | -0.0970 |
| 2 | Today Daily Change % | -0.12% |
| 3 | Today daily open | 81.682 |
The pair is trading below its 20 Daily moving average @ 82.1685, below its 50 Daily moving average @ 82.3723 , below its 100 Daily moving average @ 82.2173 and above its 200 Daily moving average @ 81.4517
| Trends | Trends.1 | |
|---|---|---|
| 0 | Daily SMA20 | 82.1685 |
| 1 | Daily SMA50 | 82.3723 |
| 2 | Daily SMA100 | 82.2173 |
| 3 | Daily SMA200 | 81.4517 |
The previous day high was 82.16 while the previous day low was 81.63. The daily 38.2% Fib levels comes at 81.8325, expected to provide resistance. Similarly, the daily 61.8% fib level is at 81.9576, expected to provide resistance.
Note the levels of interest below:
- Pivot support is noted at 81.488, 81.294, 80.958
- Pivot resistance is noted at 82.018, 82.354, 82.548
| Levels | Levels.1 |
|---|---|
| Previous Daily High | 82.1600 |
| Previous Daily Low | 81.6300 |
| Previous Weekly High | 82.5092 |
| Previous Weekly Low | 81.7741 |
| Previous Monthly High | 83.0315 |
| Previous Monthly Low | 81.5120 |
| Daily Fibonacci 38.2% | 81.8325 |
| Daily Fibonacci 61.8% | 81.9576 |
| Daily Pivot Point S1 | 81.4880 |
| Daily Pivot Point S2 | 81.2940 |
| Daily Pivot Point S3 | 80.9580 |
| Daily Pivot Point R1 | 82.0180 |
| Daily Pivot Point R2 | 82.3540 |
| Daily Pivot Point R3 | 82.5480 |
[/s2If]
Join Our Telegram Group
")


