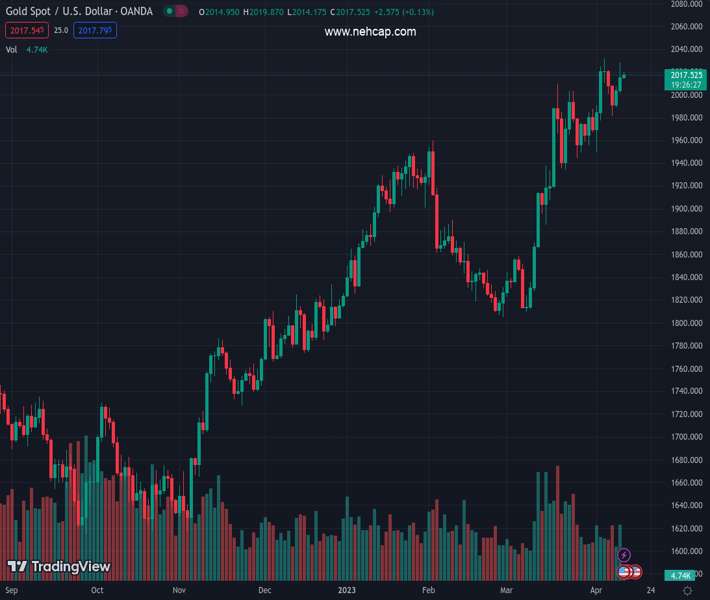
#XAUUSD @ 2,017.88 Gold price daily charts show the price hugging a supporting dynamic trendline.
…
This is a premium post.
[s2If !current_user_can(access_s2member_level4)]Please register for PREMIUM VERSION HERE to read full post below containing analysis. In case of any error or you think you are not able to read the full post below, please email us at support#nehcap.com [lwa][/s2If] [s2If current_user_can(access_s2member_level4)]
- Gold price daily charts show the price hugging a supporting dynamic trendline.
- A break above $2,030 could encourage more buying pressure toward the target.
The Gold price climbed above $2,028/oz after briefly dipping to $1,990/oz on Monday which leaves the bulls in charge as per price action and market structure, as illustrated below. Meanwhile, the market is also taking its cues on the fundamentals with respect to softening US data, in the main, and the sentiment surrounding the Federal Reserve.
On Wednesday, and ahead of Friday´s Retail Sales US data, the Consumer Price Index (CPI) climbed 0.1% in March after advancing 0.4% in February, compared with a forecast of 0.2% gain in a Reuters poll. But in the 12 months through March, the core CPI gained 5.6%, after rising 5.5% on the same basis in February. That core measure strips out volatile food and energy prices and was posting a month-on-month gain of 0.4%.
Then followed the Federal Open Market Committee minutes. These revealed very little in the way of cues ahead of next month´s interest rate decision, but there was nothing to shift the focus away from a dovish narrative. The US dollar remains on a knife edge as a consequence.
´´The minutes have confirmed our view that the FOMC will deliver a final hike of 25 bps at the May meeting and then remain on hold for the remainder of the year.,´´ analysts at Rabobank said. ´´Today’s CPI report underlines the importance of staying the course because core inflation remains persistent at a high level,´´ the analysts added.
Meanwhile, Fed funds futures traders are pricing in 69% probability that the Fed will raise rates by an additional 25 basis points at its May 2-3 meeting, down from around 76% before the data.
All in all, this has benefitted the Gold price as traders have positioned for one more hike in May followed by 2-to-1 bets of a pause in June.
Elsewhere, analysts at ANZ Bank explained that ´´the weaker USD and returning investment flows have been holding prices. Exchange-traded funds added 13,895 troy ounces of gold to their holdings in the last trading session, bringing this year’s net sales to 422,266oz, according to data compiled by Bloomberg. This was the fifth straight day of growth.´´
The weekly chart is bullish with the price breaking out of the geometrical pattern´s resistance.
The daily charts show much of the same but a target near $2,045 has been identified as oper the Fibonacci measurement of the prior bear correction´s length. The Gold price is hugging a supporting dynamic trendline and a break above $2,030 could encourage more buying pressure toward the target.
[/s2If]
Join Our Telegram Group
")


