#USDMXN @ 17.9980 Initial Jobless Claims hit 239K, exceeding estimates of 234K. (Pivot Orderbook analysis)
…
This is a premium post.
[s2If !current_user_can(access_s2member_level4)]Please register for PREMIUM VERSION HERE to read full post below containing analysis. In case of any error or you think you are not able to read the full post below, please email us at support#nehcap.com [lwa][/s2If] [s2If current_user_can(access_s2member_level4)]
- Initial Jobless Claims hit 239K, exceeding estimates of 234K.
- US inflation on the producer side edged lower, cementing the case for a Fed pivot.
- USD/MXN Price Analysis: To extend its losses past the 18.0000 support.
The pair currently trades last at 17.9980.
The previous day high was 18.1999 while the previous day low was 18.0203. The daily 38.2% Fib levels comes at 18.0889, expected to provide resistance. Similarly, the daily 61.8% fib level is at 18.1313, expected to provide resistance.
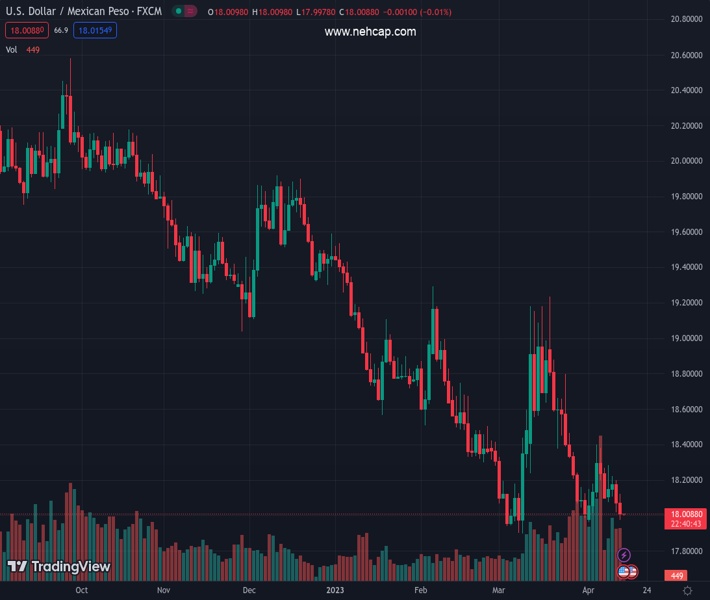
The Mexican Peso (MXN) extended its weekly gains below the 18.0000 barrier, as the USD/MXN hit a new weekly low at 17.9749. But a late bounce propelled the USD/MXN back above the 18.0000 mark, trimming some of its earlier losses. At the time of writing, the USD/MXN is trading at 18.0158, down by 0.30%.
On Thursday, the sentiment remained positive after the release of softer-than-estimated US jobs data, followed by inflation at the factory gate. Initial Jobless Claims for the week ending on April 8 exceeded estimates of 234K and hit 239K while Continuing Claims dipped. The March Producer Price Index (PPI) edged lower on annual and monthly readings, while the core PPI was mixed. Core PPI was -0.1% MoM, below estimates of 0%, while annually based dropped to 3.4% from 4.8%.
Even though traders’ bets are pricing in a 25 bps rate hike by the US Federal Reserve at the upcoming meeting, a pivot is widely expected. In addition, investors are pricing three 25 bps rate cuts by the year’s end, which spurred the US Dollar (USD) weakness across the board.
Consequently, the US Dollar Index (DXY) tracks the buck’s value vs. a basket of six currencies, drops 0.51%, and exchanges hands at 101.012, weighed by falling US bond yields. The US 2-year bond yield finished Thursday’s session flat at 3.972%, though it began Friday’s Asian session down at 3.968%.
The latest meeting minutes from the Bank of Mexico (Banxico) were released. One official commented that policy must remain restrictive for at least a couple of years, while another member mentioned that core inflation had shown “greater persistence.” That member commented that the effects of the restrictive policy would be felt “clearly” in the second half of 2024.
Lastly, the minutes showed that the board would continue to consider the inflation outlook when deciding to continue its hiking campaign.
The USD/MXN is testing support at the 18.0000 figure, which, once cleared, it could pave the way for further downside. Therefore, the USD/MXN pair’s next support would be the weekly low of 17.9749, followed by the April 3 swing low at 17.9644. Break below, and the USD/MXN will test the YTD Low at 17.8968. On the flip side, the USD/MXN first resistance would be 18.1219, followed by the 20-day EMA at 18.2085, before reclaiming the April 5 high at 18.4010.
Technical Levels: Supports and Resistances
USDMXN currently trading at 18.007 at the time of writing. Pair opened at 18.075 and is trading with a change of -0.38 % .
| Overview | Overview.1 | |
|---|---|---|
| 0 | Today last price | 18.007 |
| 1 | Today Daily Change | -0.068 |
| 2 | Today Daily Change % | -0.380 |
| 3 | Today daily open | 18.075 |
The pair remains strongly bearish on the daily time frame. It trades below the 20 SMA @ 18.3384, 50 SMA 18.4333, 100 SMA @ 18.8516 and 200 SMA @ 19.4483.
| Trends | Trends.1 | |
|---|---|---|
| 0 | Daily SMA20 | 18.3384 |
| 1 | Daily SMA50 | 18.4333 |
| 2 | Daily SMA100 | 18.8516 |
| 3 | Daily SMA200 | 19.4483 |
The previous day high was 18.1999 while the previous day low was 18.0203. The daily 38.2% Fib levels comes at 18.0889, expected to provide resistance. Similarly, the daily 61.8% fib level is at 18.1313, expected to provide resistance.
Note the levels of interest below:
- Pivot support is noted at 17.9969, 17.9188, 17.8173
- Pivot resistance is noted at 18.1764, 18.2779, 18.356
| Levels | Levels.1 |
|---|---|
| Previous Daily High | 18.1999 |
| Previous Daily Low | 18.0203 |
| Previous Weekly High | 18.4018 |
| Previous Weekly Low | 17.9660 |
| Previous Monthly High | 19.2324 |
| Previous Monthly Low | 17.8977 |
| Daily Fibonacci 38.2% | 18.0889 |
| Daily Fibonacci 61.8% | 18.1313 |
| Daily Pivot Point S1 | 17.9969 |
| Daily Pivot Point S2 | 17.9188 |
| Daily Pivot Point S3 | 17.8173 |
| Daily Pivot Point R1 | 18.1764 |
| Daily Pivot Point R2 | 18.2779 |
| Daily Pivot Point R3 | 18.3560 |
[/s2If]
Join Our Telegram Group
")


