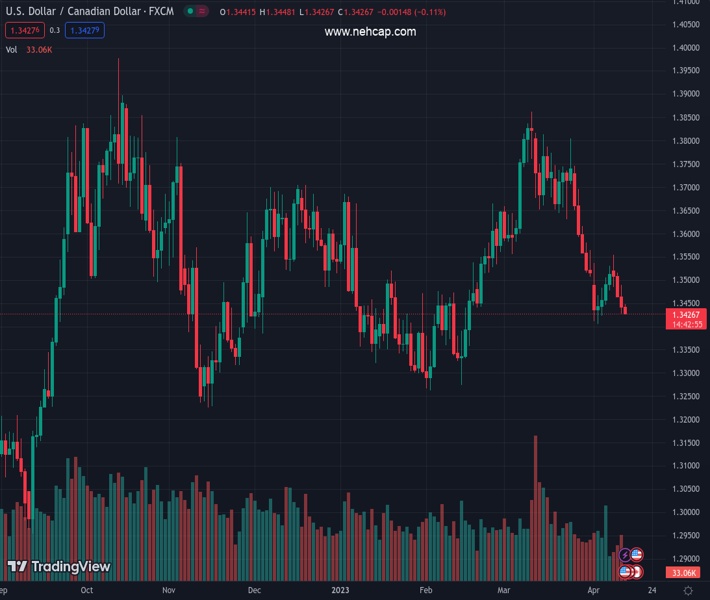
#USDCAD @ 1.34303 has gauged buying interest after dropping below 1.3430 amid a recovery in the USD Index. (Pivot Orderbook analysis)
…
This is a premium post.
[s2If !current_user_can(access_s2member_level4)]Please register for PREMIUM VERSION HERE to read full post below containing analysis. In case of any error or you think you are not able to read the full post below, please email us at support#nehcap.com [lwa][/s2If] [s2If current_user_can(access_s2member_level4)]
- USD/CAD has gauged buying interest after dropping below 1.3430 amid a recovery in the USD Index.
- Hawkish Federal Reserve bets despite cooling US Inflation have provided a cushion to the US Dollar.
- Bank of Canada Governor kept policy rates steady at 4.5% citing that the current monetary policy is restrictive enough to tame sticky inflation.
- USD/CAD is declining towards the horizontal resistance plotted from April 04 low at 1.3406.
The pair currently trades last at 1.34303.
The previous day high was 1.3489 while the previous day low was 1.3428. The daily 38.2% Fib levels comes at 1.3451, expected to provide resistance. Similarly, the daily 61.8% fib level is at 1.3466, expected to provide resistance.
The USD/CAD pair has sensed buying interest after defending the crucial support of 1.3430 in the early European session. The Loonie asset is looking to extend its recovery above the immediate resistance of 1.3437. The major has grabbed the attention of responsive buyers after a recovery move in the US Dollar Index (DXY). The USD Index has rebounded after building a firm base around weekly lows at 101.44 as hawkish Federal Reserve (Fed) bets are full of strength despite softening of United States inflation as expected by the market participants.
S&P500 futures have turned positive after negating bearish cues inspired by renewed fears of the US recession, portraying a recovery in the risk appetite of the market participants. US equities faces pressure on Wednesday and settled weak after Federal Open Market Committee (FOMC) minutes confirmed that the economy will face a mild recession later this year. It is highly likely that tight credit conditions by US commercial banks after the banking collapse and higher rates from the Federal Reserve will push the economy into recession.
Meanwhile, the demand for US Treasury bonds has improved on expectations that a slowdown in the US economy would force the Federal Reserve to consider rate cuts later. The yields offered on 10-year US Treasury bonds have slipped to near 3.41%.
The US Dollar remained a major victim on Wednesday after US Consumer Price Index (CPI) softens more than expected and Fed policymakers anticipated a mild recession ahead, which would propel a dial back of quantitative easing. However, a scrutiny of US inflation is telling a different story. The US CPI report indicates that headline inflation has softened more than expectations to 5.0% vs. the former release of 6.0%. A deceleration in headline inflation was the outcome of weaker gasoline prices. The investing community is aware of the fact that oil prices have significantly rebounded in April after a surprise announcement of production cuts by OPEC+, which could spoil Gold Bull’s party in the coming months.
Speaking on the headline inflation, core CPI has rebounded to 5.6% as expected vs. 5.5% the former release as rent prices remained persistent. This indicates that core inflation could remain extremely stubborn ahead.
It would be early to consider a pause in the Quantitative tightening spell as inflation is still far from the desired target of 2%. San Francisco Fed Bank President Mary Daly said late Wednesday, “There’s a lot more in the pipeline of monetary policy tightening,” as reported by Reuters. However, she refrained from forecasting the end of the tightening cycle.
The Canadian Dollar remained firm on Wednesday against the US Dollar despite the Bank of Canada (BoC) keeping its policy rates steady at 4.5%. Bank of Canada Governor Tiff Macklem believes that the current monetary policy is restrictive enough to tame sticky inflation.
The Bank of Canada also ignored upbeat Employment data, released last week, and maintained the status quo, in spite of the fact that upbeat demand for labor could fuel labor earnings and assures a recovery in Canada’s inflation. Analysts at TD Securities expect “The Bank of Canada’s interest rate to remain at 4.50% for all of 2023, as we do expect growth to slow markedly in Q2. That said, if the expected softening in the labor market does not emerge, the Bank of Canada may have little choice but to tighten it again. With markets likely to give the Bank of Canada a pass in June, we see more risk for rate hikes in the July and September meetings.”
USD/CAD is auctioning in a Falling Channel chart pattern on an hourly scale in which every pullback is capitalized by investors as a selling opportunity. The Loonie asset is declining towards the horizontal resistance plotted from April 04 low at 1.3406.
The 50-period Exponential Moving Average (EMA) at 1.3460 is barricading US Dollar bulls from any kind of recovery.
A slippage of the Relative Strength Index (RSI) (14) into the bearish range of 20.00-40.00 will trigger the downside momentum.
Technical Levels: Supports and Resistances
USDCAD currently trading at 1.3436 at the time of writing. Pair opened at 1.3442 and is trading with a change of -0.04 % .
| Overview | Overview.1 | |
|---|---|---|
| 0 | Today last price | 1.3436 |
| 1 | Today Daily Change | -0.0006 |
| 2 | Today Daily Change % | -0.0400 |
| 3 | Today daily open | 1.3442 |
The pair is trading below its 20 Daily moving average @ 1.3582, below its 50 Daily moving average @ 1.3563 , below its 100 Daily moving average @ 1.3531 and above its 200 Daily moving average @ 1.3397
| Trends | Trends.1 | |
|---|---|---|
| 0 | Daily SMA20 | 1.3582 |
| 1 | Daily SMA50 | 1.3563 |
| 2 | Daily SMA100 | 1.3531 |
| 3 | Daily SMA200 | 1.3397 |
The previous day high was 1.3489 while the previous day low was 1.3428. The daily 38.2% Fib levels comes at 1.3451, expected to provide resistance. Similarly, the daily 61.8% fib level is at 1.3466, expected to provide resistance.
Note the levels of interest below:
- Pivot support is noted at 1.3417, 1.3392, 1.3355
- Pivot resistance is noted at 1.3478, 1.3514, 1.3539
| Levels | Levels.1 |
|---|---|
| Previous Daily High | 1.3489 |
| Previous Daily Low | 1.3428 |
| Previous Weekly High | 1.3537 |
| Previous Weekly Low | 1.3406 |
| Previous Monthly High | 1.3862 |
| Previous Monthly Low | 1.3508 |
| Daily Fibonacci 38.2% | 1.3451 |
| Daily Fibonacci 61.8% | 1.3466 |
| Daily Pivot Point S1 | 1.3417 |
| Daily Pivot Point S2 | 1.3392 |
| Daily Pivot Point S3 | 1.3355 |
| Daily Pivot Point R1 | 1.3478 |
| Daily Pivot Point R2 | 1.3514 |
| Daily Pivot Point R3 | 1.3539 |
[/s2If]
Join Our Telegram Group
")


