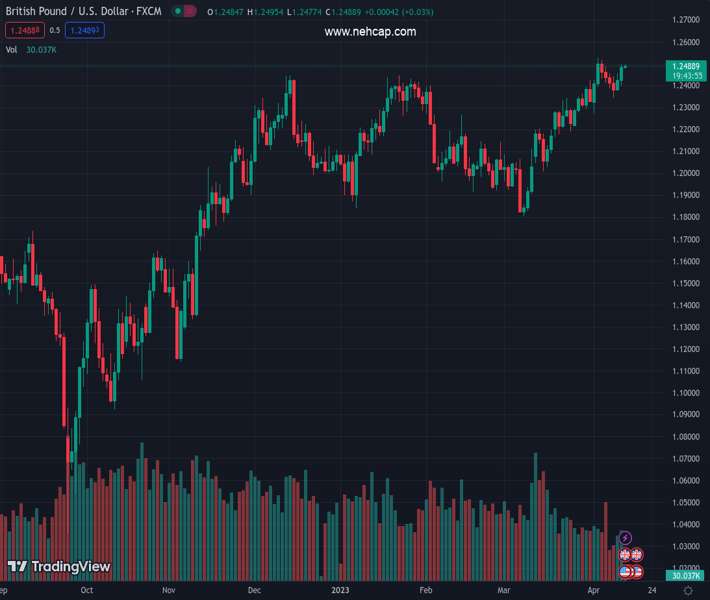
#GBPUSD @ 1.24885 is expected to witness significant gains above 1.2500 as declining US inflation has weighed heavily on the US Dollar. (Pivot Orderbook analysis)
…
This is a premium post.
[s2If !current_user_can(access_s2member_level4)]Please register for PREMIUM VERSION HERE to read full post below containing analysis. In case of any error or you think you are not able to read the full post below, please email us at support#nehcap.com [lwa][/s2If] [s2If current_user_can(access_s2member_level4)]
- GBP/USD is expected to witness significant gains above 1.2500 as declining US inflation has weighed heavily on the US Dollar.
- The Pound Sterling is expected to show some action ahead of the release of the UK GDP and production-related (Feb) data.
- The impact of the weakness in US gasoline prices in March will be reflected in PPI figures.
The pair currently trades last at 1.24885.
The previous day high was 1.2495 while the previous day low was 1.2399. The daily 38.2% Fib levels comes at 1.2458, expected to provide support. Similarly, the daily 61.8% fib level is at 1.2436, expected to provide support.
The GBP/USD pair is gathering strength for recapturing the psychological resistance of 1.2500 in the Asian session. The Cable got significant bids on Wednesday after United States inflation softened as anticipated by the market participants.
The Pound Sterling is expected to show some action ahead of the release of the United Kingdom Gross Domestic Product (GDP) and production-related (Feb) data. Monthly GDP is expected to expand by 0.1% vs. the former expansion of 0.3%. Industrial and Manufacturing Production is likely to expand by 0.2% on a monthly basis.
Meanwhile, the US Dollar Index (DXY) seems vulnerable around 101.47 and is likely to witness more downside as the impact of weakness in gasoline prices in March will be reflected in Producer Price Index (PPI) figures. Monthly headline PPI is expected to remain stagnant against a deflation of 0.1%. Annual headline PPI would soften heavily to 3.0% from the prior release of 4.6%.
GBP/USD is marching towards the horizontal resistance placed from April 04 high at 1.2525 on an hourly scale. The Cable has got an adrenaline rush after a breakout of the Falling Channel chart pattern.
Upward-sloping 20-period Exponential Moving Average (EMA) at 1.2466 indicates more upside ahead.
An oscillation in the 60.00-80.00 range by the Relative Strength Index (RSI) (14) indicates that the bullish momentum is already active.
For further upside, the Cable needs to surpass the psychological resistance of 1.2500, which will drive the asset towards April 04 high at 1.2525. A breach of the latter would expose the Cable to a fresh nine-month high at 1.2597, which is 08 June 2022 high.
On the flip side, a break below the round-level support of 1.2400 will expose the asset to April 10 low at 1.2344 and March 30 low at 1.2294.
Technical Levels: Supports and Resistances
GBPUSD currently trading at 1.2493 at the time of writing. Pair opened at 1.2483 and is trading with a change of 0.08 % .
| Overview | Overview.1 | |
|---|---|---|
| 0 | Today last price | 1.2493 |
| 1 | Today Daily Change | 0.0010 |
| 2 | Today Daily Change % | 0.0800 |
| 3 | Today daily open | 1.2483 |
The pair remains strongly bullish on the daily timeframe. It trades above its 20 SMA @ 1.2338, 50 SMA 1.216, 100 SMA @ 1.2174 and 200 SMA @ 1.1909.
| Trends | Trends.1 | |
|---|---|---|
| 0 | Daily SMA20 | 1.2338 |
| 1 | Daily SMA50 | 1.2160 |
| 2 | Daily SMA100 | 1.2174 |
| 3 | Daily SMA200 | 1.1909 |
The previous day high was 1.2495 while the previous day low was 1.2399. The daily 38.2% Fib levels comes at 1.2458, expected to provide support. Similarly, the daily 61.8% fib level is at 1.2436, expected to provide support.
Note the levels of interest below:
- Pivot support is noted at 1.2422, 1.2362, 1.2326
- Pivot resistance is noted at 1.2519, 1.2556, 1.2616
| Levels | Levels.1 |
|---|---|
| Previous Daily High | 1.2495 |
| Previous Daily Low | 1.2399 |
| Previous Weekly High | 1.2525 |
| Previous Weekly Low | 1.2275 |
| Previous Monthly High | 1.2424 |
| Previous Monthly Low | 1.1803 |
| Daily Fibonacci 38.2% | 1.2458 |
| Daily Fibonacci 61.8% | 1.2436 |
| Daily Pivot Point S1 | 1.2422 |
| Daily Pivot Point S2 | 1.2362 |
| Daily Pivot Point S3 | 1.2326 |
| Daily Pivot Point R1 | 1.2519 |
| Daily Pivot Point R2 | 1.2556 |
| Daily Pivot Point R3 | 1.2616 |
[/s2If]
Join Our Telegram Group
")


