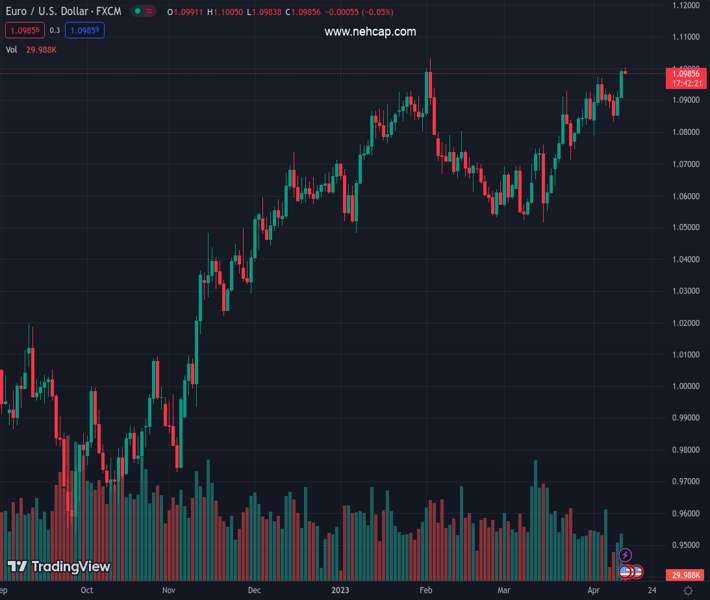
#EURUSD @ 1.09840 is facing hurdles in stretching its rally above 1.1000 as USD Index has attempted a recovery (Pivot Orderbook analysis)
…
This is a premium post.
[s2If !current_user_can(access_s2member_level4)]Please register for PREMIUM VERSION HERE to read full post below containing analysis. In case of any error or you think you are not able to read the full post below, please email us at support#nehcap.com [lwa][/s2If] [s2If current_user_can(access_s2member_level4)]
- EUR/USD is facing hurdles in stretching its rally above 1.1000 as USD Index has attempted a recovery
- S&P500 futures have recovered losses generated in early Asia, portraying a recovery in the risk appetite.
- Monthly US Retail Sales data is expected to maintain its pace of contraction by 0.4%.
The pair currently trades last at 1.09840.
The previous day high was 1.1 while the previous day low was 1.0911. The daily 38.2% Fib levels comes at 1.0966, expected to provide support. Similarly, the daily 61.8% fib level is at 1.0945, expected to provide support.
The EUR/USD pair is facing resistance in extending its rally above the psychological resistance of 1.1000 in the Asian session. The shared currency pair is struggling to accelerate further as the US Dollar index (DXY) has defended further downside after testing its weekly low of 101.44.
The major currency pair displayed a stellar north-side move on Wednesday after United States inflation landed lower as expected. Weak gasoline prices in March were a major catalyst for the extensive softening of the headline Consumer Price Index (CPI) to 5.0%. While core CPI that excludes oil and food prices rebounded to 5.6% as rent prices remained persistent.
Also, the release of Federal Reserve (Fed) minutes strengthened the downside bias for the USD Index. Fed minutes conveyed that 25 basis points (bps) interest rate hike was a last-minute move as policymakers were in favor of a 50 bps rate hike. The Fed decided to go light on interest rates due to banking turmoil.
Meanwhile, S&P500 futures have recovered losses generated in early Asia and have turned positive, at the time of writing, portraying a recovery in the risk appetite of the market participants. It seems that investors are digesting fears of a mild recession, which is anticipated by Fed policymakers later this year as per Federal Open Market Committee (FOMC) minutes.
Going forward, US Retail Sales data will remain in the spotlight. Monthly Retail Sales data is expected to maintain its pace of contraction by 0.4%.
On the Eurozone front, rising oil prices are posing a threat of recovery in inflationary pressures. The shared continent is a major importer of oil and higher oil prices could fuel inflation again. This might force the European Central Bank (ECB) to hike rates further.
ECB Governing Council member Robert Holzmann cited on Wednesday, “Inflation outlook argues for another 50bps hike in May.” He further added, “ECB needs to keep raising rates noticeably beyond May.”
Technical Levels: Supports and Resistances
EURUSD currently trading at 1.0993 at the time of writing. Pair opened at 1.0992 and is trading with a change of 0.01 % .
| Overview | Overview.1 | |
|---|---|---|
| 0 | Today last price | 1.0993 |
| 1 | Today Daily Change | 0.0001 |
| 2 | Today Daily Change % | 0.0100 |
| 3 | Today daily open | 1.0992 |
The pair remains strongly bullish on the daily timeframe. It trades above its 20 SMA @ 1.0839, 50 SMA 1.0736, 100 SMA @ 1.0698 and 200 SMA @ 1.0362.
| Trends | Trends.1 | |
|---|---|---|
| 0 | Daily SMA20 | 1.0839 |
| 1 | Daily SMA50 | 1.0736 |
| 2 | Daily SMA100 | 1.0698 |
| 3 | Daily SMA200 | 1.0362 |
The previous day high was 1.1 while the previous day low was 1.0911. The daily 38.2% Fib levels comes at 1.0966, expected to provide support. Similarly, the daily 61.8% fib level is at 1.0945, expected to provide support.
Note the levels of interest below:
- Pivot support is noted at 1.0935, 1.0878, 1.0845
- Pivot resistance is noted at 1.1025, 1.1057, 1.1114
| Levels | Levels.1 |
|---|---|
| Previous Daily High | 1.1000 |
| Previous Daily Low | 1.0911 |
| Previous Weekly High | 1.0973 |
| Previous Weekly Low | 1.0788 |
| Previous Monthly High | 1.0930 |
| Previous Monthly Low | 1.0516 |
| Daily Fibonacci 38.2% | 1.0966 |
| Daily Fibonacci 61.8% | 1.0945 |
| Daily Pivot Point S1 | 1.0935 |
| Daily Pivot Point S2 | 1.0878 |
| Daily Pivot Point S3 | 1.0845 |
| Daily Pivot Point R1 | 1.1025 |
| Daily Pivot Point R2 | 1.1057 |
| Daily Pivot Point R3 | 1.1114 |
[/s2If]
Join Our Telegram Group
")


