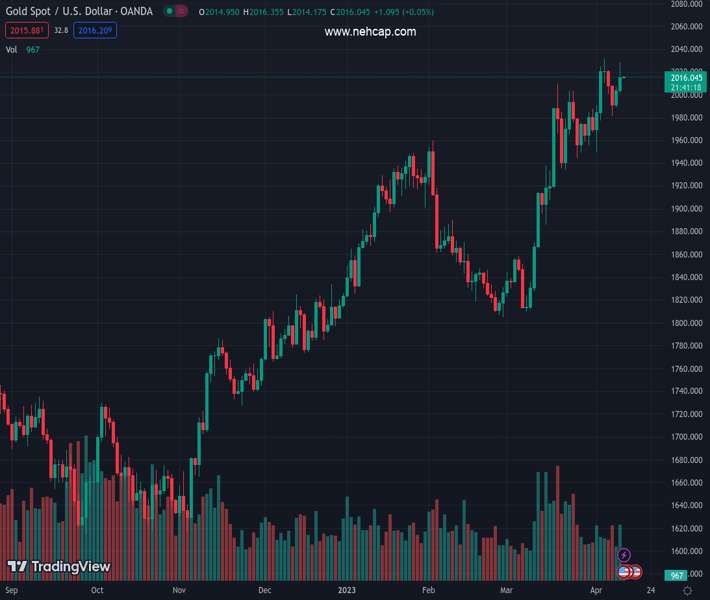
#XAUUSD @ 2,015.86 Gold price extends early week rebound, grinds higher of late., @nehcap view: Further upside expected (Pivot Orderbook analysis)
…
This is a premium post.
[s2If !current_user_can(access_s2member_level4)]Please register for PREMIUM VERSION HERE to read full post below containing analysis. In case of any error or you think you are not able to read the full post below, please email us at support#nehcap.com [lwa][/s2If] [s2If current_user_can(access_s2member_level4)]
- Gold price extends early week rebound, grinds higher of late.
- United States inflation, Federal Reserve Minutes weigh on US Treasury bond yields, USD and inspire XAU/USD buyers.
- Markets are in consolidation mode and hence Gold price pullback can’t be ruled out.
- More clues of US inflation, risk catalysts eyed for clear directions
The pair currently trades last at 2015.86.
The previous day high was 2007.52 while the previous day low was 1988.88. The daily 38.2% Fib levels comes at 2000.4, expected to provide support. Similarly, the daily 61.8% fib level is at 1996.0, expected to provide support.
Gold price (XAU/USD) remains sidelined around $2,015, mildly bid during the three-day uptrend, as broad-based US Dollar weakness joins downbeat United States Treasury bond yields. Behind the moves are the latest United States inflation numbers and the Minutes of the Federal Open Market Committee (FOMC) Monetary Policy Meeting.
Gold price rose on Wednesday after the downbeat prints of United States inflation and no fresh or impressive details from the Minutes of the latest Federal Reserve (Fed) monetary policy meeting weighed on the US Dollar and Treasury bond yields, via Fed bets.
On Wednesday, United States inflation measure, per the Consumer Price Index (CPI), dropped to the lowest level since May 2021, to 5.0% YoY in March from 6.0% prior and versus 5.2% market forecasts. However, the annual Core CPI, namely the CPI ex Food & Energy, improved to 5.6% YoY during the said month while matching forecasts and surpassing 5.5% prior.
That said, the Minutes of the latest Federal Open Market Committee (FOMC) Monetary Policy Meeting signaled that the expectations for rate hikes were scaled back due to the turmoil in the banking sector, which in turn offered no fresh information and raised doubts on the hawkish Fed moves, apart from May’s 0.25% rate hike. “Several Federal Reserve policymakers last month considered pausing interest rate increases after the failure of two regional banks and a forecast from Fed staff that banking sector stress would tip the economy into recession,” mentioned Reuters.
Following the data, San Francisco Federal Reserve Bank President Mary Daly said that they had good news on inflation but added that she doesn’t want to forecast the end of the tightening cycle. On the same line, Richmond Federal Reserve President Thomas Barkin said on Tuesday, in an interview with CNBC, that inflation certainly has peaked but warned that there are still ways to go.
As the aforementioned catalysts flashed downbeat signals for the Federal Reserve’s next move, the US Dollar Index (DXY) dropped to a one-week low and the Treasury bond yields marked their first daily loss of the week. That said, the US 10-year Treasury bond yields snapped three-day uptrend with mild losses to around 3.40% while the two-year counterpart also eased to 3.96% by marking the first daily negative in five.
Having witnessed that the initial signals of the United States inflation and the FOMC Minutes both suggest the Fed’s policy pivot and underpin the Gold price upside, the XAU/USD traders may pay attention to more details of inflation to reconfirm the bullish bias about the bullion. As a result, today’s United State Producer Price Index (PPI) for March and Friday’s preliminary readings of Michigan Consumer Sentiment Index for April will be closely observed. Above all, the Fed talks and the yields are crucial for Gold traders to follow for clear directions.
Gold price remains well past the short-term key supports despite the latest inaction. Also keeping the XAU/USD buyers hopeful is the near-50 condition of the Relative Strength Index (RSI), placed at 14, as well as the sluggish signals from the Moving Average Convergence and Divergence (MACD) indicator.
That said, a one-week-old ascending trend line and the 200-Hour Moving Average (HMA), respectively near $2,003 and $1,995, can restrict the short-term downside of the Gold price.
Following that, the previous resistance line from March 20, close to $1,982 at the latest, may act as the last defense of the XAU/USD bulls.
Meanwhile, a sustained upside break of $2,032 could defy the chatters that the Gold buyers are off the ground by portraying a run-up toward the previous yearly high of around $2,070.
In a case where the XAU/USD remains firmer past $2,070, the record high of the $2,075 mark printed in 2020 will be in the spotlight.
Trend: Further upside expected
Technical Levels: Supports and Resistances
XAUUSD currently trading at 2015.22 at the time of writing. Pair opened at 2003.83 and is trading with a change of 0.57 % .
| Overview | Overview.1 | |
|---|---|---|
| 0 | Today last price | 2015.22 |
| 1 | Today Daily Change | 11.39 |
| 2 | Today Daily Change % | 0.57 |
| 3 | Today daily open | 2003.83 |
The pair remains strongly bullish on the daily timeframe. It trades above its 20 SMA @ 1973.27, 50 SMA 1901.75, 100 SMA @ 1867.33 and 200 SMA @ 1789.62.
| Trends | Trends.1 | |
|---|---|---|
| 0 | Daily SMA20 | 1973.27 |
| 1 | Daily SMA50 | 1901.75 |
| 2 | Daily SMA100 | 1867.33 |
| 3 | Daily SMA200 | 1789.62 |
The previous day high was 2007.52 while the previous day low was 1988.88. The daily 38.2% Fib levels comes at 2000.4, expected to provide support. Similarly, the daily 61.8% fib level is at 1996.0, expected to provide support.
Note the levels of interest below:
- Pivot support is noted at 1992.63, 1981.44, 1973.99
- Pivot resistance is noted at 2011.27, 2018.72, 2029.91
| Levels | Levels.1 |
|---|---|
| Previous Daily High | 2007.52 |
| Previous Daily Low | 1988.88 |
| Previous Weekly High | 2032.11 |
| Previous Weekly Low | 1949.83 |
| Previous Monthly High | 2009.88 |
| Previous Monthly Low | 1809.46 |
| Daily Fibonacci 38.2% | 2000.40 |
| Daily Fibonacci 61.8% | 1996.00 |
| Daily Pivot Point S1 | 1992.63 |
| Daily Pivot Point S2 | 1981.44 |
| Daily Pivot Point S3 | 1973.99 |
| Daily Pivot Point R1 | 2011.27 |
| Daily Pivot Point R2 | 2018.72 |
| Daily Pivot Point R3 | 2029.91 |
[/s2If]
Join Our Telegram Group
")


