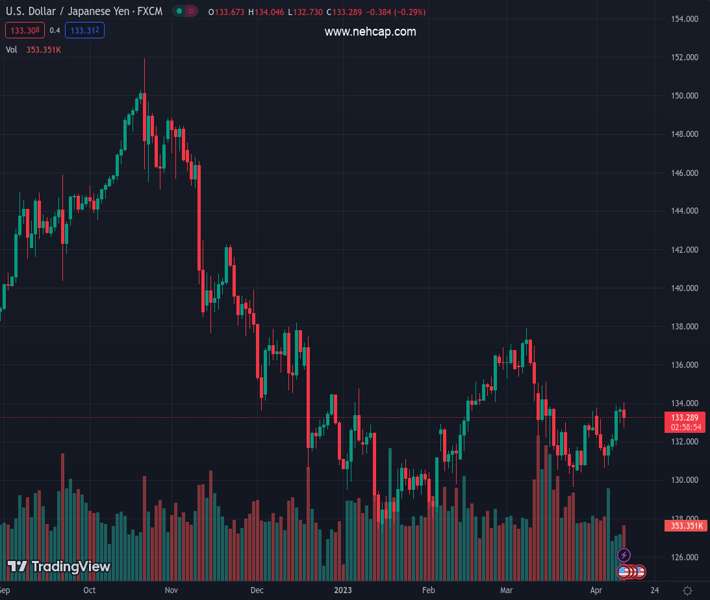
#USDJPY @ 133.368 The retraced after hitting a daily high of 134.00, though solid resistance pressured USD Bulls. (Pivot Orderbook analysis)
…
This is a premium post.
[s2If !current_user_can(access_s2member_level4)]Please register for PREMIUM VERSION HERE to read full post below containing analysis. In case of any error or you think you are not able to read the full post below, please email us at support#nehcap.com [lwa][/s2If] [s2If current_user_can(access_s2member_level4)]
- The USD/JPY retraced after hitting a daily high of 134.00, though solid resistance pressured USD Bulls.
- USD/JPY Price Analysis: Downside expected as it remains below 133.77; otherwise, once reclaiming 134.00, 135.00 would be up for grabs.
The pair currently trades last at 133.368.
The previous day high was 133.81 while the previous day low was 132.97. The daily 38.2% Fib levels comes at 133.49, expected to provide resistance. Similarly, the daily 61.8% fib level is at 133.29, expected to provide support.
The USD/JPY remains downward pressured, following a release of inflation figures in the United States (US) dipped, though core inflation stood unchanged for two straight months. At the time of typing, the USD/JPY is trading at 133.33, snapping four days of gains after hitting a high of 134.04.
From a technical perspective, the USD/JPY is trapped within the 200 and 50-day EMAs at 133.70 and 133.09. the USD/JPY peaking on Tuesday at around 133.80 was difficult to surpass, as shown by Wednesday’s price action. Nonetheless, the USD/JPY needs a daily close below the 200-day EMA to cement the case for a neutral-to-downward biased, exerting selling pressure on the USD/JPY pair.
If USD/JPY achieves that scenario, the next support would be the 133.000 figure. A breach of the latter will expose the 20-day EMA at 132.70, followed by the 132.00 mark. On the other hand, a USD/JPY resumption above the 200-day EMA will exacerbate a recovery above the confluence of the 100-day EMA and the 134.00 figure. Once cleared, the USD/JPY could threaten January’s 6 high at 134.77, before reaching the 135.00 figure.
Technical Levels: Supports and Resistances
USDJPY currently trading at 133.31 at the time of writing. Pair opened at 133.67 and is trading with a change of -0.27 % .
| Overview | Overview.1 | |
|---|---|---|
| 0 | Today last price | 133.31 |
| 1 | Today Daily Change | -0.36 |
| 2 | Today Daily Change % | -0.27 |
| 3 | Today daily open | 133.67 |
The pair is trading above its 20 Daily moving average @ 132.17, above its 50 Daily moving average @ 133.26 , below its 100 Daily moving average @ 133.32 and below its 200 Daily moving average @ 137.2
| Trends | Trends.1 | |
|---|---|---|
| 0 | Daily SMA20 | 132.17 |
| 1 | Daily SMA50 | 133.26 |
| 2 | Daily SMA100 | 133.32 |
| 3 | Daily SMA200 | 137.20 |
The previous day high was 133.81 while the previous day low was 132.97. The daily 38.2% Fib levels comes at 133.49, expected to provide resistance. Similarly, the daily 61.8% fib level is at 133.29, expected to provide support.
Note the levels of interest below:
- Pivot support is noted at 133.16, 132.65, 132.33
- Pivot resistance is noted at 133.99, 134.32, 134.82
| Levels | Levels.1 |
|---|---|
| Previous Daily High | 133.81 |
| Previous Daily Low | 132.97 |
| Previous Weekly High | 133.76 |
| Previous Weekly Low | 130.63 |
| Previous Monthly High | 137.91 |
| Previous Monthly Low | 129.64 |
| Daily Fibonacci 38.2% | 133.49 |
| Daily Fibonacci 61.8% | 133.29 |
| Daily Pivot Point S1 | 133.16 |
| Daily Pivot Point S2 | 132.65 |
| Daily Pivot Point S3 | 132.33 |
| Daily Pivot Point R1 | 133.99 |
| Daily Pivot Point R2 | 134.32 |
| Daily Pivot Point R3 | 134.82 |
[/s2If]
Join Our Telegram Group
")


