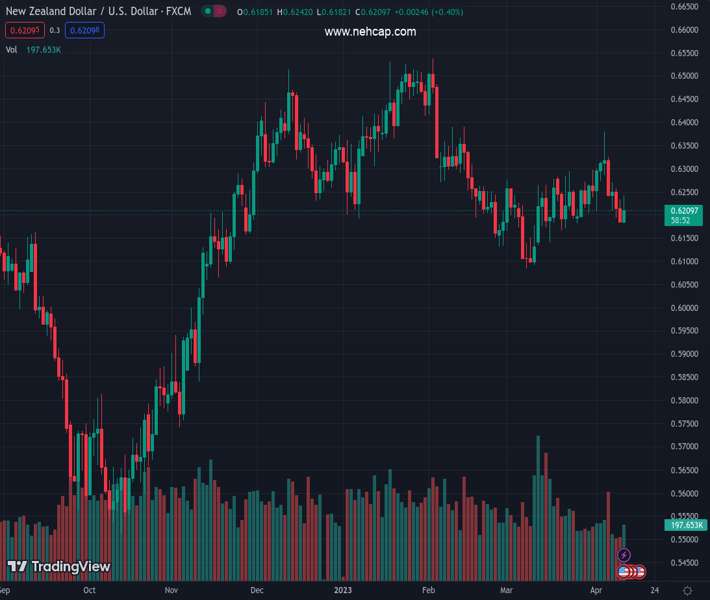
#NZDUSD @ 0.62089 advanced after the US CPI dipped, despite the core CPI remaining unchanged. (Pivot Orderbook analysis)
…
This is a premium post.
[s2If !current_user_can(access_s2member_level4)]Please register for PREMIUM VERSION HERE to read full post below containing analysis. In case of any error or you think you are not able to read the full post below, please email us at support#nehcap.com [lwa][/s2If] [s2If current_user_can(access_s2member_level4)]
- NZD/USD advanced after the US CPI dipped, despite the core CPI remaining unchanged.
- FOMC minutes showed that the banking crisis in the US put into the table a pause in the tightening cycle.
- NZD/USD Price Analysis: The upside could be capped by daily EMAs, but once cleared, it can rally to 0.6300.
The pair currently trades last at 0.62089.
The previous day high was 0.6234 while the previous day low was 0.6183. The daily 38.2% Fib levels comes at 0.6202, expected to provide support. Similarly, the daily 61.8% fib level is at 0.6215, expected to provide resistance.
The NZD/USD made a U-turn and climbs after the latest FOMC minutes flashed that Fed officials were eyeing a pause on their tightening campaign. Also, US inflation figures mixed keep investors leaning towards a riskier asset, as shown by Wall Street about to finish with minimal gains. At the time of writing, the NZD/USD is trading at 0.6217.
During the recent Federal Reserve monetary policy meeting, officials discussed the possibility of holding rates unchanged following the failure of two regional banks. This decision was motivated by concerns that further tightening could cause financial stress. Despite this, participants agreed that the Fed’s measures had helped ease worries in the banking sector. These measures were similar to those the Bank of England took after the bond turmoil resulting from former Prime Minister Liz Truss’s mini-budget. Against this backdrop, the Fed’s latest meeting supported a 25 basis point rate hike.
Participants commented that inflation is still above the 2% goal and that inflation pressures were “abating at a pace sufficient to return inflation to 2% over time.” Some Fed members noted that they considered a 50-basis point increase if there was not a banking crisis. Furthermore, Fed policymakers observed, “that inflation remained much too high and that the labor market remained too tight.”
Earlier, an inflation report from the US revealed that headline CPI dropped from 6% in February to 5% annually. However, core inflation, which excludes food and energy, remained at 5.6% YoY, unchanged.
The NZD/USD snapped two days of consecutive losses and is forming a bullish engulfing candlestick pattern. Although the pattern suggests that further upside is expected, the NZD/USD needs to clear a busy resistance area, with the 20, 100, and 50-day EMAs, at 0.6235, 0.6240, and 0.6246, respectively. Once that area is cleared, the NZD/USD could rally toward the February 14 high at 0.6389.
Technical Levels: Supports and Resistances
NZDUSD currently trading at 0.6213 at the time of writing. Pair opened at 0.6202 and is trading with a change of 0.18 % .
| Overview | Overview.1 | |
|---|---|---|
| 0 | Today last price | 0.6213 |
| 1 | Today Daily Change | 0.0011 |
| 2 | Today Daily Change % | 0.1800 |
| 3 | Today daily open | 0.6202 |
The pair is trading below its 20 Daily moving average @ 0.6241, below its 50 Daily moving average @ 0.6248 , below its 100 Daily moving average @ 0.6304 and above its 200 Daily moving average @ 0.616
| Trends | Trends.1 | |
|---|---|---|
| 0 | Daily SMA20 | 0.6241 |
| 1 | Daily SMA50 | 0.6248 |
| 2 | Daily SMA100 | 0.6304 |
| 3 | Daily SMA200 | 0.6160 |
The previous day high was 0.6234 while the previous day low was 0.6183. The daily 38.2% Fib levels comes at 0.6202, expected to provide support. Similarly, the daily 61.8% fib level is at 0.6215, expected to provide resistance.
Note the levels of interest below:
- Pivot support is noted at 0.6178, 0.6155, 0.6127
- Pivot resistance is noted at 0.6229, 0.6257, 0.628
| Levels | Levels.1 |
|---|---|
| Previous Daily High | 0.6234 |
| Previous Daily Low | 0.6183 |
| Previous Weekly High | 0.6389 |
| Previous Weekly Low | 0.6207 |
| Previous Monthly High | 0.6298 |
| Previous Monthly Low | 0.6084 |
| Daily Fibonacci 38.2% | 0.6202 |
| Daily Fibonacci 61.8% | 0.6215 |
| Daily Pivot Point S1 | 0.6178 |
| Daily Pivot Point S2 | 0.6155 |
| Daily Pivot Point S3 | 0.6127 |
| Daily Pivot Point R1 | 0.6229 |
| Daily Pivot Point R2 | 0.6257 |
| Daily Pivot Point R3 | 0.6280 |
[/s2If]
Join Our Telegram Group
")


