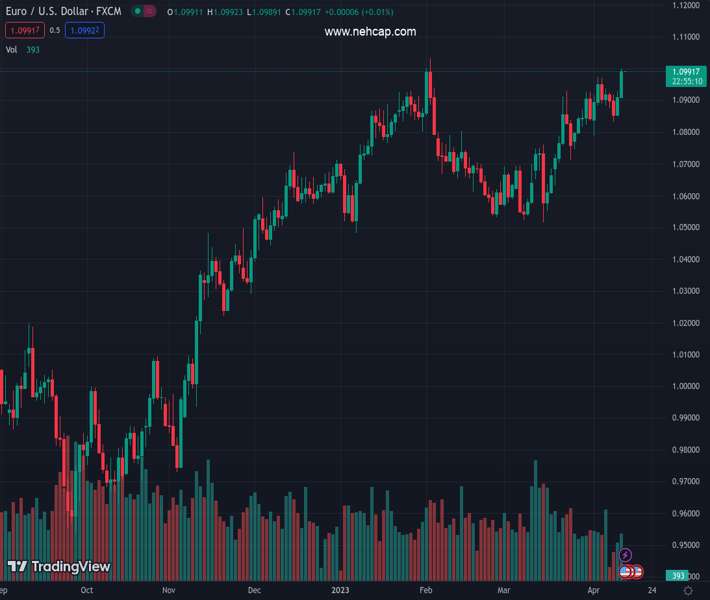
#EURUSD @ 1.09913 has touched the psychological resistance of 1.1000 as US Inflation has softened as expected. (Pivot Orderbook analysis)
…
This is a premium post.
[s2If !current_user_can(access_s2member_level4)]Please register for PREMIUM VERSION HERE to read full post below containing analysis. In case of any error or you think you are not able to read the full post below, please email us at support#nehcap.com [lwa][/s2If] [s2If current_user_can(access_s2member_level4)]
- EUR/USD has touched the psychological resistance of 1.1000 as US Inflation has softened as expected.
- S&P500 settled Wednesday’s session on a negative note as the minutes from the Fed’s March meeting have flagged recession fears.
- Monthly Retail Sales data would contract by 0.4%, at a similar pace to the prior contraction.
The pair currently trades last at 1.09913.
The previous day high was 1.0928 while the previous day low was 1.0857. The daily 38.2% Fib levels comes at 1.0901, expected to provide support. Similarly, the daily 61.8% fib level is at 1.0884, expected to provide support.
The EUR/USD pair has kissed the psychological resistance of 1.1000 in the early Asian session for the first time in more than two months. The major currency pair is facing barricades in extending its rally above the same, however, the upside is still solid as the United States inflation has softened as expected by the market participants.
The US Dollar Index (DXY) has dropped perpendicularly to near 101.53 on hopes that the Federal Reserve (Fed) would consider an early pause in the policy-tightening spell. The USD Index is expected to slip further below its weekly low of 101.42.
Meanwhile, S&P500 settled Wednesday’s session on a negative note as the minutes from the Federal Reserve’s March meeting have flagged recession fears for later this year. Fed policymakers expect a mild recession led by the banking crisis. Also, anxiety over the quarterly result season forced investors to take caution. The market has turned asset-specific where equities are expected to witness sheer volatility while risk-sensitive currencies are getting traction.
As expected, headline inflation accelerated by merely 0.1% as weaker oil prices offered gasoline at cheaper rates. The annual headline inflation softened beyond expectations to 5% from the prior release of 6%. However, core inflation that strips off oil and food prices accelerated to 5.6% vs. 5.5% released earlier. The catalyst that fueled blood into core inflation is the persistent rent prices.
However, Fed policymakers are confident that US inflation will soften further to the middle of 3% by this year and will go down to desired levels in 2024.
Going forward, Friday’s US Retail Sales data will be keenly watched. Monthly Retail Sales data would contract by 0.4%, at a similar pace to the prior contraction. This might bolster the need to pause rates by Fed chair Jerome Powell.
On the Eurozone front, more rate hikes from the European Central Bank (ECB) are in the pipeline as inflation is extremely stubborn. Shortage of labor has been a major constraint of persistent inflation and now higher oil prices could elevate inflation further.
Technical Levels: Supports and Resistances
EURUSD currently trading at 1.0992 at the time of writing. Pair opened at 1.0912 and is trading with a change of 0.73 % .
| Overview | Overview.1 | |
|---|---|---|
| 0 | Today last price | 1.0992 |
| 1 | Today Daily Change | 0.0080 |
| 2 | Today Daily Change % | 0.7300 |
| 3 | Today daily open | 1.0912 |
The pair remains strongly bullish on the daily timeframe. It trades above its 20 SMA @ 1.0819, 50 SMA 1.0736, 100 SMA @ 1.0692 and 200 SMA @ 1.0358.
| Trends | Trends.1 | |
|---|---|---|
| 0 | Daily SMA20 | 1.0819 |
| 1 | Daily SMA50 | 1.0736 |
| 2 | Daily SMA100 | 1.0692 |
| 3 | Daily SMA200 | 1.0358 |
The previous day high was 1.0928 while the previous day low was 1.0857. The daily 38.2% Fib levels comes at 1.0901, expected to provide support. Similarly, the daily 61.8% fib level is at 1.0884, expected to provide support.
Note the levels of interest below:
- Pivot support is noted at 1.087, 1.0827, 1.0798
- Pivot resistance is noted at 1.0941, 1.097, 1.1013
| Levels | Levels.1 |
|---|---|
| Previous Daily High | 1.0928 |
| Previous Daily Low | 1.0857 |
| Previous Weekly High | 1.0973 |
| Previous Weekly Low | 1.0788 |
| Previous Monthly High | 1.0930 |
| Previous Monthly Low | 1.0516 |
| Daily Fibonacci 38.2% | 1.0901 |
| Daily Fibonacci 61.8% | 1.0884 |
| Daily Pivot Point S1 | 1.0870 |
| Daily Pivot Point S2 | 1.0827 |
| Daily Pivot Point S3 | 1.0798 |
| Daily Pivot Point R1 | 1.0941 |
| Daily Pivot Point R2 | 1.0970 |
| Daily Pivot Point R3 | 1.1013 |
[/s2If]
Join Our Telegram Group
")


