#GBPUSD @ 1.24172 grinds higher after an upbeat start to the key week. (Pivot Orderbook analysis)
…
This is a premium post.
[s2If !current_user_can(access_s2member_level4)]Please register for PREMIUM VERSION HERE to read full post below containing analysis. In case of any error or you think you are not able to read the full post below, please email us at support#nehcap.com [lwa][/s2If] [s2If current_user_can(access_s2member_level4)]
- GBP/USD grinds higher after an upbeat start to the key week.
- OPEC+ verdict fails to underpin US Dollar despite fueling Oil prices.
- Cable ignore Brexit criticism, downbeat UK inflation expectations amid broad US Dollar.
- Softer US data, yields join receding hawkish Fed bets to weigh GBP/USD price.
The pair currently trades last at 1.24172.
The previous day high was 1.2424 while the previous day low was 1.2324. The daily 38.2% Fib levels comes at 1.2362, expected to provide support. Similarly, the daily 61.8% fib level is at 1.2386, expected to provide support.
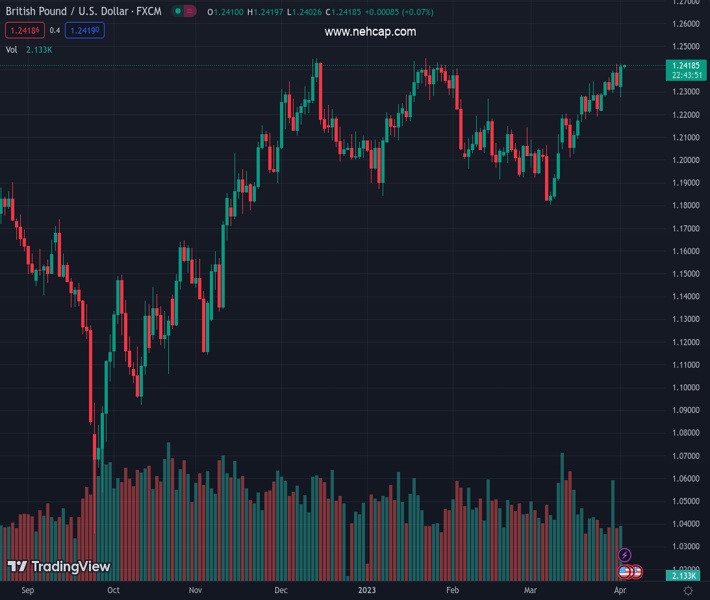
GBP/USD remains firmer around 1.2420 during early Tuesday in Asia as bulls approach the multi-day-old resistance area amid broad US Dollar weakness. In doing so, the Cable pair ignores downbeat inflation forecasts and Brexit concerns at home amid optimistic comments from the Bank of England (BoE) Officials.
That said, the US Dollar Index (DXY) dropped the most in a fortnight the previous day to test the lowest levels in two months as downbeat US data and yields weigh on the Federal Reserve (Fed) bets.
On Monday, US ISM Manufacturing PMI dropped to the lowest levels since May 2020 in March, to 46.3 versus 47.5 expected and 47.7 prior. On the same line, the final readings of March’s S&P Global Manufacturing PMI eased to 49.2 compared to 49.3 initial estimations.
Softer US PMIs joined the market’s lack of fears from the OPEC+ supply cuts and the resulting Oil price run-up to weigh n the yields. That said, the US 10-year Treasury bond yields printed a four-day downtrend to 3.41% at the latest.
With this, the CME’s FedWatch Tool marked nearly 43% market bets on the Fed’s 0.25% rate hike in May, versus 52% expected on Friday.
At home, Bank of England (BoE) Chief Economist Huw Pill crossed wires via Reuters while saying, “The UK banking system is well capitalized.” The policymaker also said that the Well-capitalized banks help combat inflation, though inflation is still far too high.
Further, the latest monthly survey from Citi and YouGov, published on Monday, said the UK public’s inflation expectations eased in March after edging a tad higher in February. ‘For 12 months ahead, the UK public inflation expectations eased to 5.4% in March from 5.6% in February,” states the survey details.
It should be noted that No10’s confirmation that the traffic jam at Dover port was due to Brexit and political chaos around grooming gangs prod the GBP/USD buyers.
Amid these plays, Wall Street closed mixed while the riskier assets cheered the US Dollar’s weakness.
Moving on, a light calendar may allow the Cable pair to remain firmer for the day. However, Wednesday’s US ADP Employment Change, ISM Services PMI and Friday’s US Nonfarm Payrolls (NFP) are the keys for the GBP/USD pair traders to watch for clear directions.
GBP/USD approaches the 1.2445-50 key resistance area comprising multiple tops marked since early December 2022. It’s worth noting that the RSI (14) conditions are firmer this time, suggesting brighter chances of the quote’s run-up beyond the critical upside hurdle. Meanwhile, the Cable sellers need validation from February’s high of 1.2270.
Technical Levels: Supports and Resistances
GBPUSD currently trading at 1.2418 at the time of writing. Pair opened at 1.2338 and is trading with a change of 0.65% % .
| Overview | Overview.1 | |
|---|---|---|
| 0 | Today last price | 1.2418 |
| 1 | Today Daily Change | 0.0080 |
| 2 | Today Daily Change % | 0.65% |
| 3 | Today daily open | 1.2338 |
The pair remains strongly bullish on the daily timeframe. It trades above its 20 SMA @ 1.2163, 50 SMA 1.2149, 100 SMA @ 1.213 and 200 SMA @ 1.1895.
| Trends | Trends.1 | |
|---|---|---|
| 0 | Daily SMA20 | 1.2163 |
| 1 | Daily SMA50 | 1.2149 |
| 2 | Daily SMA100 | 1.2130 |
| 3 | Daily SMA200 | 1.1895 |
The previous day high was 1.2424 while the previous day low was 1.2324. The daily 38.2% Fib levels comes at 1.2362, expected to provide support. Similarly, the daily 61.8% fib level is at 1.2386, expected to provide support.
Note the levels of interest below:
- Pivot support is noted at 1.23, 1.2262, 1.2201
- Pivot resistance is noted at 1.2399, 1.2461, 1.2499
| Levels | Levels.1 |
|---|---|
| Previous Daily High | 1.2424 |
| Previous Daily Low | 1.2324 |
| Previous Weekly High | 1.2424 |
| Previous Weekly Low | 1.2219 |
| Previous Monthly High | 1.2424 |
| Previous Monthly Low | 1.1803 |
| Daily Fibonacci 38.2% | 1.2362 |
| Daily Fibonacci 61.8% | 1.2386 |
| Daily Pivot Point S1 | 1.2300 |
| Daily Pivot Point S2 | 1.2262 |
| Daily Pivot Point S3 | 1.2201 |
| Daily Pivot Point R1 | 1.2399 |
| Daily Pivot Point R2 | 1.2461 |
| Daily Pivot Point R3 | 1.2499 |
[/s2If]
Join Our Telegram Group
")


