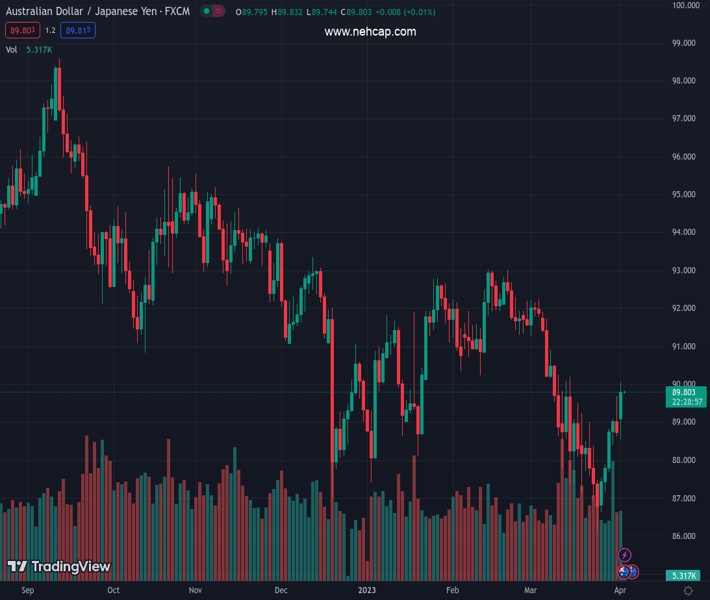
#AUDJPY @ 89.8030 pair tests 50-DMA but fails to hold gains, capped by technical resistance. (Pivot Orderbook analysis)
…
This is a premium post.
[s2If !current_user_can(access_s2member_level4)]Please register for PREMIUM VERSION HERE to read full post below containing analysis. In case of any error or you think you are not able to read the full post below, please email us at support#nehcap.com [lwa][/s2If] [s2If current_user_can(access_s2member_level4)]
- AUD/JPY pair tests 50-DMA but fails to hold gains, capped by technical resistance.
- AUD/JPY must break through 50-day EMA and 90.00 figure for bullish continuation.
- For a bearish scenario, the AUD/JPY must reclaim the 20-DMA at 89.04.
The pair currently trades last at 89.8030.
The previous day high was 89.68 while the previous day low was 88.63. The daily 38.2% Fib levels comes at 89.03, expected to provide support. Similarly, the daily 61.8% fib level is at 89.28, expected to provide support.
The AUD/JPY rallied sharply on upbeat market sentiment and hit a three-week high at 90.05 but retreated somewhat towards the end of Monday’s session. As the Asian session begins, the AUD/JPY is trading at 89.81
On Monday, the AUD/JPY pair tested the 50-day Exponential Moving Average (EMA)at 89.93 but could not hold to its gains above the latter. Additionally, it tested an upslope previous support trendline and turned resistance, which capped AUD/JPY’s upward move. Oscillators like the Relative Strength Index (RSI) at bullish territory shifted flat, suggesting buyers are taking a respite. The Rate of Change (RoC) portrays that buying pressure is cooling. Hence, the AUD/JPY might consolidate in the near term.
The AUD/JPY must crack the 50-day EMA and the 90.00 figure for a bullish continuation. Once cleared, the AUD/JPY could test the 100-day EMA at 90.78 before approaching the 200-day EMA at 91.04. In an alternate scenario, a bearish one, the AUD/JPY first support would be the 20-day EMA at 89.04. Break below, and the AUD/JPY will head toward the week’s low of 88.55, ahead of challenging 88.00.
Technical Levels: Supports and Resistances
AUDJPY currently trading at 89.79 at the time of writing. Pair opened at 88.83 and is trading with a change of 1.08 % .
| Overview | Overview.1 | |
|---|---|---|
| 0 | Today last price | 89.79 |
| 1 | Today Daily Change | 0.96 |
| 2 | Today Daily Change % | 1.08 |
| 3 | Today daily open | 88.83 |
The pair is trading above its 20 Daily moving average @ 88.78, below its 50 Daily moving average @ 90.64 , below its 100 Daily moving average @ 91.0 and below its 200 Daily moving average @ 92.62
| Trends | Trends.1 | |
|---|---|---|
| 0 | Daily SMA20 | 88.78 |
| 1 | Daily SMA50 | 90.64 |
| 2 | Daily SMA100 | 91.00 |
| 3 | Daily SMA200 | 92.62 |
The previous day high was 89.68 while the previous day low was 88.63. The daily 38.2% Fib levels comes at 89.03, expected to provide support. Similarly, the daily 61.8% fib level is at 89.28, expected to provide support.
Note the levels of interest below:
- Pivot support is noted at 88.41, 88.0, 87.36
- Pivot resistance is noted at 89.47, 90.1, 90.52
| Levels | Levels.1 |
|---|---|
| Previous Daily High | 89.68 |
| Previous Daily Low | 88.63 |
| Previous Weekly High | 89.68 |
| Previous Weekly Low | 86.67 |
| Previous Monthly High | 92.25 |
| Previous Monthly Low | 86.06 |
| Daily Fibonacci 38.2% | 89.03 |
| Daily Fibonacci 61.8% | 89.28 |
| Daily Pivot Point S1 | 88.41 |
| Daily Pivot Point S2 | 88.00 |
| Daily Pivot Point S3 | 87.36 |
| Daily Pivot Point R1 | 89.47 |
| Daily Pivot Point R2 | 90.10 |
| Daily Pivot Point R3 | 90.52 |
[/s2If]
Join Our Telegram Group
")


