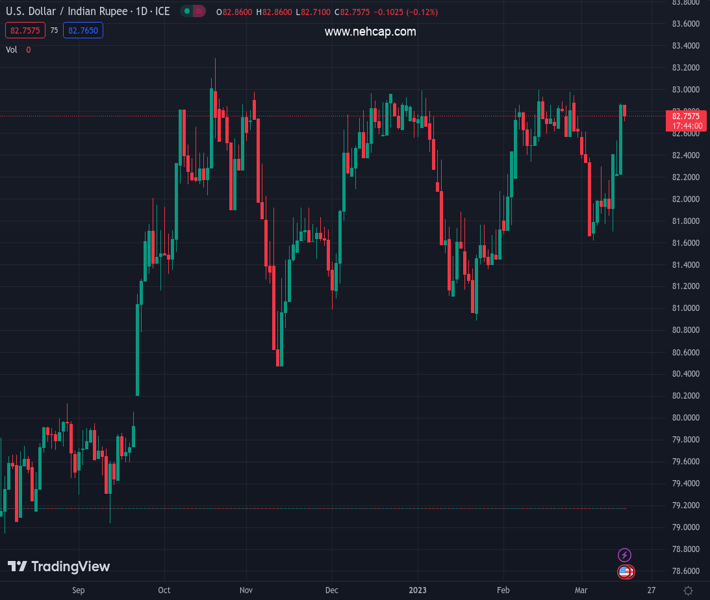
#USDINR @ 82.7630 has slipped to near 82.68 as USD Index has extended its correction. (Pivot Orderbook analysis)
…
This is a premium post.
[s2If !current_user_can(access_s2member_level4)]Please register for PREMIUM VERSION HERE to read full post below containing analysis. In case of any error or you think you are not able to read the full post below, please email us at support#nehcap.com [lwa][/s2If] [s2If current_user_can(access_s2member_level4)]
- USD/INR has slipped to near 82.68 as USD Index has extended its correction.
- Investors are anticipating a less-hawkish monetary policy stance from the Fed after scrutiny of February’s US economic data.
- Oil price is struggling to extend its recovery above $68.00 as fears of a banking sector meltdown would result in lower advances.
The pair currently trades last at 82.7630.
The previous day high was 83.0315 while the previous day low was 82.2125. The daily 38.2% Fib levels comes at 82.7186, expected to provide support. Similarly, the daily 61.8% fib level is at 82.5254, expected to provide support.
The USD/INR pair has shifted its auction below the critical support of 82.80 in the Asian session. The asset is expected to remain on the tenterhooks as investors are anticipating a less-hawkish monetary policy stance from the Federal Reserve (Fed) after scrutiny of United States economic data (Feb). The major has slipped to near 82.68 and it seems that more losses are in pipeline ahead.
S&P500 futures have eased some of the gains generated in the early Asian session as the risk-aversion theme has not entirely faded. The 500-US stocks basket futures are likely to remain volatile as fears of the global banking crisis have stretched after the debacle of Credit Suisse. Although the Swiss National Bank (SNB) has promised to provide liquidity support to the investment banking firm, fears of global financial instability cannot be ruled out.
Considering the statement from Credit Suisse chairman Axel Lehmann that state assistance “isn’t a topic” for the bank as it seeks to recover from a string of scandals that have undermined the confidence of investors and clients, Bloomberg reported, the downfall of Credit Suisse is not expected to heal sooner.
The US Dollar Index (DXY) has extended its correction to near 104.50 amid soaring uncertainty over the interest rate decision by the Federal Reserve (Fed), which will be announced on March 22. The rally in the USD Index, witnessed on Wednesday, was backed by fears of global banking turmoil. And now investors are expected to discount the less-hawkish pitch to be delivered by Fed chair Jerome Powell over interest rates next week.
In order to restore the confidence of households and investors, the Fed might keep the borrowing rates steady or go for a 25 basis point (bps) rate hike to continue weighing pressure on the United States inflation.
Meanwhile, oil price is struggling to extend its recovery above $68.00 as fears of a banking sector meltdown would result in the lower release of advances. This might scale down the oil price further. It is worth noting that India is one of the leading importers of oil in the world and lower oil prices would trim India’s fiscal deficit.
Technical Levels: Supports and Resistances
USDINR currently trading at 82.731 at the time of writing. Pair opened at 82.7169 and is trading with a change of 0.02 % .
| Overview | Overview.1 | |
|---|---|---|
| 0 | Today last price | 82.7310 |
| 1 | Today Daily Change | 0.0141 |
| 2 | Today Daily Change % | 0.0200 |
| 3 | Today daily open | 82.7169 |
The pair remains strongly bullish on the daily timeframe. It trades above its 20 SMA @ 82.4317, 50 SMA 82.1341, 100 SMA @ 82.1266 and 200 SMA @ 81.0594.
| Trends | Trends.1 | |
|---|---|---|
| 0 | Daily SMA20 | 82.4317 |
| 1 | Daily SMA50 | 82.1341 |
| 2 | Daily SMA100 | 82.1266 |
| 3 | Daily SMA200 | 81.0594 |
The previous day high was 83.0315 while the previous day low was 82.2125. The daily 38.2% Fib levels comes at 82.7186, expected to provide support. Similarly, the daily 61.8% fib level is at 82.5254, expected to provide support.
Note the levels of interest below:
- Pivot support is noted at 82.2758, 81.8346, 81.4568
- Pivot resistance is noted at 83.0948, 83.4726, 83.9138
| Levels | Levels.1 |
|---|---|
| Previous Daily High | 83.0315 |
| Previous Daily Low | 82.2125 |
| Previous Weekly High | 82.3126 |
| Previous Weekly Low | 81.6120 |
| Previous Monthly High | 83.0820 |
| Previous Monthly Low | 81.5032 |
| Daily Fibonacci 38.2% | 82.7186 |
| Daily Fibonacci 61.8% | 82.5254 |
| Daily Pivot Point S1 | 82.2758 |
| Daily Pivot Point S2 | 81.8346 |
| Daily Pivot Point S3 | 81.4568 |
| Daily Pivot Point R1 | 83.0948 |
| Daily Pivot Point R2 | 83.4726 |
| Daily Pivot Point R3 | 83.9138 |
[/s2If]
Join Our Telegram Group
")


