#USDCHF @ 0.93033 eases from the one-week high to pare the previous day’s heavy gains., @nehcap view: Limited downside expected (Pivot Orderbook analysis)
…
This is a premium post.
[s2If !current_user_can(access_s2member_level4)]Please register for PREMIUM VERSION HERE to read full post below containing analysis. In case of any error or you think you are not able to read the full post below, please email us at support#nehcap.com [lwa][/s2If] [s2If current_user_can(access_s2member_level4)]
- USD/CHF eases from the one-week high to pare the previous day’s heavy gains.
- Nearly overbought RSI favors pullback from 100-SMA, six-week-old previous support line adds to the upside filters.
- 200-SMA holds the key to the further downside; bullish MACD signals also test Swiss currency pair sellers.
The pair currently trades last at 0.93033.
The previous day high was 0.9165 while the previous day low was 0.9096. The daily 38.2% Fib levels comes at 0.9139, expected to provide support. Similarly, the daily 61.8% fib level is at 0.9123, expected to provide support.
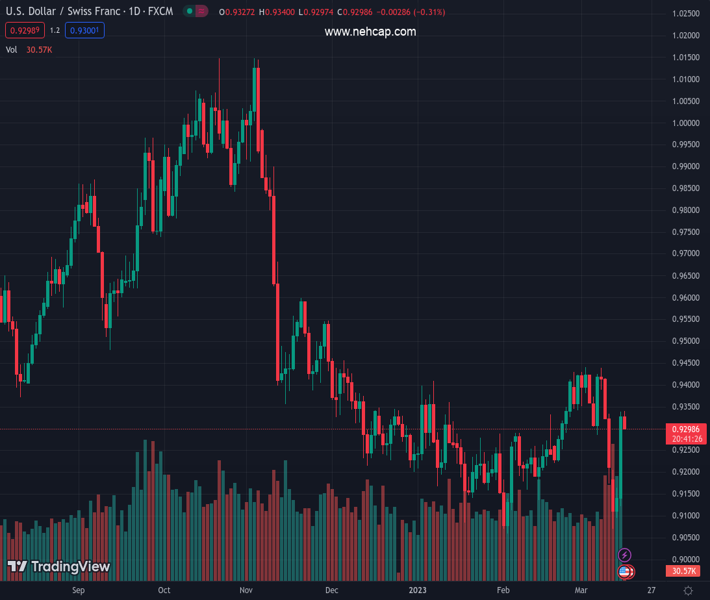
USD/CHF drops to 0.9313 as bulls take a breather during active trading hours of early Thursday, following a stellar run-up during the previous day.
In doing so, the Swiss currency pair retreats from the 100-bar Simple Moving Average (SMA) amid the overbought RSI conditions. Adding strength to the latest pullback could be the global policymakers’ recent announcements to tame the financial market risks, especially after the Credit Suisse turmoil.
Also read: Forex Today: Dollar and Yen jump as panic takes over markets
It’s worth noting, however, that the bullish MACD signals challenge the USD/CHF bears, which in turn highlights the importance of the 200-SMA level of 0.9270 as the key support. That said, the pair sellers also need validation from the 0.9300 immediate support.
In a case where USD/CHF breaks the 200-SMA support, the odds of witnessing a slump towards the 50% and 61.8% Fibonacci retracement levels of February-March run-up, respectively near .9250 and 0.9200, can’t be ruled out.
Alternatively, the 100-SMA and the previous support line from early February, close to 0.9325 and 0.9350 in that order, restrict short-term USD/CHF upside.
Following that, a run-up towards crossing the double tops near 0.9435-40 appears more likely.
To sum up, USD/CHF is expected to pare recent gains but the downside room seems limited.
Trend: Limited downside expected
Technical Levels: Supports and Resistances
USDCHF currently trading at 0.9311 at the time of writing. Pair opened at 0.9142 and is trading with a change of 1.85% % .
| Overview | Overview.1 | |
|---|---|---|
| 0 | Today last price | 0.9311 |
| 1 | Today Daily Change | 0.0169 |
| 2 | Today Daily Change % | 1.85% |
| 3 | Today daily open | 0.9142 |
The pair is trading below its 20 Daily moving average @ 0.9311, above its 50 Daily moving average @ 0.926 , below its 100 Daily moving average @ 0.9385 and below its 200 Daily moving average @ 0.9555
| Trends | Trends.1 | |
|---|---|---|
| 0 | Daily SMA20 | 0.9311 |
| 1 | Daily SMA50 | 0.9260 |
| 2 | Daily SMA100 | 0.9385 |
| 3 | Daily SMA200 | 0.9555 |
The previous day high was 0.9165 while the previous day low was 0.9096. The daily 38.2% Fib levels comes at 0.9139, expected to provide support. Similarly, the daily 61.8% fib level is at 0.9123, expected to provide support.
Note the levels of interest below:
- Pivot support is noted at 0.9104, 0.9066, 0.9035
- Pivot resistance is noted at 0.9172, 0.9203, 0.9241
| Levels | Levels.1 |
|---|---|
| Previous Daily High | 0.9165 |
| Previous Daily Low | 0.9096 |
| Previous Weekly High | 0.9439 |
| Previous Weekly Low | 0.9175 |
| Previous Monthly High | 0.9429 |
| Previous Monthly Low | 0.9059 |
| Daily Fibonacci 38.2% | 0.9139 |
| Daily Fibonacci 61.8% | 0.9123 |
| Daily Pivot Point S1 | 0.9104 |
| Daily Pivot Point S2 | 0.9066 |
| Daily Pivot Point S3 | 0.9035 |
| Daily Pivot Point R1 | 0.9172 |
| Daily Pivot Point R2 | 0.9203 |
| Daily Pivot Point R3 | 0.9241 |
[/s2If]
Join Our Telegram Group
")


