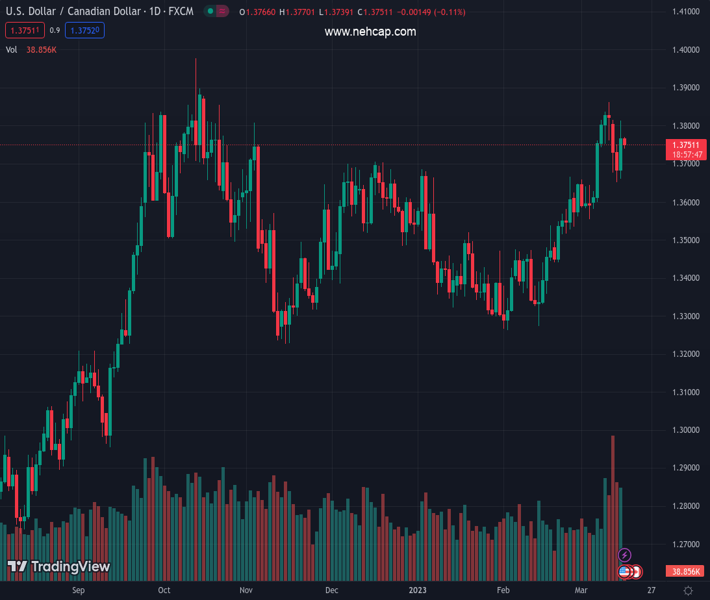
#USDCAD @ 1.37516 has slipped below 1.3750 as expectations for Fed’s steady policy escalate. (Pivot Orderbook analysis)
…
This is a premium post.
[s2If !current_user_can(access_s2member_level4)]Please register for PREMIUM VERSION HERE to read full post below containing analysis. In case of any error or you think you are not able to read the full post below, please email us at support#nehcap.com [lwa][/s2If] [s2If current_user_can(access_s2member_level4)]
- USD/CAD has slipped below 1.3750 as expectations for Fed’s steady policy escalate.
- A scrutiny of February’s US inflation-linked data indicates that January’s inflation revival was a one-time blip.
- Oil price looks vulnerable above $68.00 as tightening policies for banking system by central banks could dent oil demand ahead.
The pair currently trades last at 1.37516.
The previous day high was 1.3814 while the previous day low was 1.366. The daily 38.2% Fib levels comes at 1.3756, expected to provide resistance. Similarly, the daily 61.8% fib level is at 1.3719, expected to provide support.
The USD/CAD pair has corrected to near the critical support of 1.3750 in the Tokyo session. The Loonie asset is facing the heat as the upside momentum in the US Dollar Index has started fading now. The street is anticipating maintenance of status-quo by the Federal Reserve (Fed) next week as United States inflation has resumed its softening spell meaningfully.
Scrutiny of February’s US Consumer Price Index, Employment report, Retail Sales, and Producer Price Index (PPI) figures indicate that January’s economic data was a one-time blip. The US inflation has resumed its downside journey and the joining of fears associated with the global banking crisis is stemming an unchanged policy stance on interest rates.
The odds of a 50 basis point (bps) interest rate hike by the Fed have majorly faded, however, the other school of thought is still standing with a 25 bps rate hike expectation. Citing former senior Bank for International Settlements official and ex-New York Fed research director Stephen Cecchetti, MNI reported on Wednesday, “The Fed will likely approve a quarter-point interest rate increase next week as focus shifts from strong economic data to restoring confidence in the banking system.”
S&P500 futures have recovered a majority of Wednesday’s losses in the Asian session as investors have started shrugging off the uncertainty associated with global banking turmoil after Credit Suisse’s debacle and Silicon Valley Bank’s (SVB) collapse. The US Dollar Index (DXY) has turned sideways near the immediate support of 104.60 and is expected to remain on tenterhooks ahead.
Meanwhile, the oil price looks vulnerable above $68.00 after a recovery move as tightening policies for the banking system by central banks could dent oil demand further. It is worth noting that Canada is the leading exporter of oil to the United States and lower oil prices would impact the Canadian Dollar.
Technical Levels: Supports and Resistances
USDCAD currently trading at 1.3754 at the time of writing. Pair opened at 1.3767 and is trading with a change of -0.09 % .
| Overview | Overview.1 | |
|---|---|---|
| 0 | Today last price | 1.3754 |
| 1 | Today Daily Change | -0.0013 |
| 2 | Today Daily Change % | -0.0900 |
| 3 | Today daily open | 1.3767 |
The pair remains strongly bullish on the daily timeframe. It trades above its 20 SMA @ 1.3632, 50 SMA 1.3489, 100 SMA @ 1.3507 and 200 SMA @ 1.333.
| Trends | Trends.1 | |
|---|---|---|
| 0 | Daily SMA20 | 1.3632 |
| 1 | Daily SMA50 | 1.3489 |
| 2 | Daily SMA100 | 1.3507 |
| 3 | Daily SMA200 | 1.3330 |
The previous day high was 1.3814 while the previous day low was 1.366. The daily 38.2% Fib levels comes at 1.3756, expected to provide resistance. Similarly, the daily 61.8% fib level is at 1.3719, expected to provide support.
Note the levels of interest below:
- Pivot support is noted at 1.368, 1.3593, 1.3526
- Pivot resistance is noted at 1.3835, 1.3902, 1.3989
| Levels | Levels.1 |
|---|---|
| Previous Daily High | 1.3814 |
| Previous Daily Low | 1.3660 |
| Previous Weekly High | 1.3862 |
| Previous Weekly Low | 1.3582 |
| Previous Monthly High | 1.3666 |
| Previous Monthly Low | 1.3262 |
| Daily Fibonacci 38.2% | 1.3756 |
| Daily Fibonacci 61.8% | 1.3719 |
| Daily Pivot Point S1 | 1.3680 |
| Daily Pivot Point S2 | 1.3593 |
| Daily Pivot Point S3 | 1.3526 |
| Daily Pivot Point R1 | 1.3835 |
| Daily Pivot Point R2 | 1.3902 |
| Daily Pivot Point R3 | 1.3989 |
[/s2If]
Join Our Telegram Group
")


