#NZDUSD @ 0.61742 bounces off intraday low but stays down for the second consecutive day., @nehcap view: Further downside expected (Pivot Orderbook analysis)
…
This is a premium post.
[s2If !current_user_can(access_s2member_level4)]Please register for PREMIUM VERSION HERE to read full post below containing analysis. In case of any error or you think you are not able to read the full post below, please email us at support#nehcap.com [lwa][/s2If] [s2If current_user_can(access_s2member_level4)]
- NZD/USD bounces off intraday low but stays down for the second consecutive day.
- Bearish MACD signals, downbeat RSI keeps sellers hopeful amid failures to cross 200-SMA, one-month-old resistance line.
- Weekly ascending trend line, YTD low lures Kiwi bears.
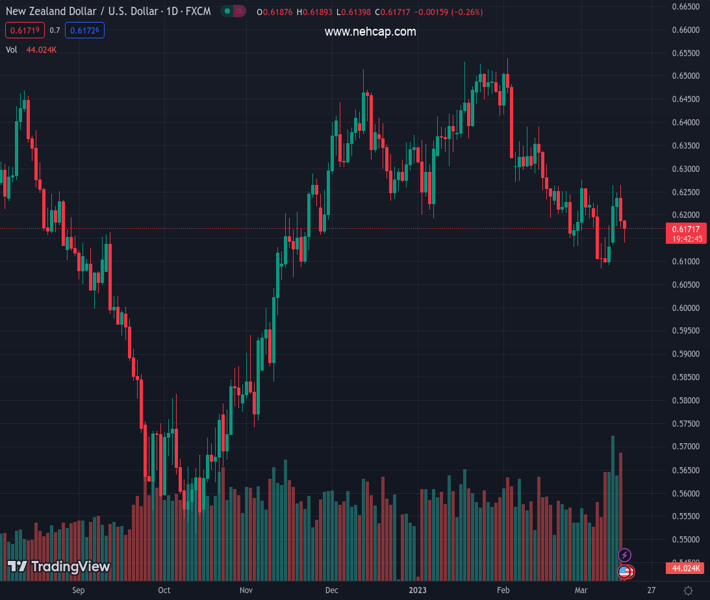
The pair currently trades last at 0.61742.
The previous day high was 0.6271 while the previous day low was 0.6172. The daily 38.2% Fib levels comes at 0.621, expected to provide resistance. Similarly, the daily 61.8% fib level is at 0.6233, expected to provide resistance.
NZD/USD picks up bids to pare intraday losses around 0.6175 during early Thursday. Even so, the Kiwi pair remains down for the second consecutive day after reversing from the 200-SMA and one-month-old resistance line the previous day.
The NZD/USD pair’s failure to cross the aforementioned key hurdles joins bearish MACD signals and the downbeat RSI (14) line, not oversold, to keep the sellers hopeful of witnessing the quote’s further downside.
As a result, an upward-sloping support line from the last Thursday, near 0.6115 at the latest, gains the attention of intraday bears ahead of the monthly low, as well as the 2023 bottom, marked around 0.6085 in the last week.
It should be noted that the NZD/USD pair’s weakness past 0.6085 will need validation from the July 2022 low of 0.6060 to aim for the 0.6000 psychological magnet, also comprising the early September 2022 bottom.
Meanwhile, the 23.6% Fibonacci retracement level of the Kiwi pair’s February-March downside, near 0.6190, precedes the 0.6200 threshold to restrict immediate NZD/USD upside.
In a case where the quote remains firmer past 0.6200, the previously mentioned resistance line from mid-February and the 200-SMA, respectively near 0.6240 and 0.6265, will be in the spotlight.
Trend: Further downside expected
Technical Levels: Supports and Resistances
NZDUSD currently trading at 0.6176 at the time of writing. Pair opened at 0.6188 and is trading with a change of -0.19% % .
| Overview | Overview.1 | |
|---|---|---|
| 0 | Today last price | 0.6176 |
| 1 | Today Daily Change | -0.0012 |
| 2 | Today Daily Change % | -0.19% |
| 3 | Today daily open | 0.6188 |
The pair is trading below its 20 Daily moving average @ 0.6196, below its 50 Daily moving average @ 0.6315 , below its 100 Daily moving average @ 0.6254 and above its 200 Daily moving average @ 0.6164
| Trends | Trends.1 | |
|---|---|---|
| 0 | Daily SMA20 | 0.6196 |
| 1 | Daily SMA50 | 0.6315 |
| 2 | Daily SMA100 | 0.6254 |
| 3 | Daily SMA200 | 0.6164 |
The previous day high was 0.6271 while the previous day low was 0.6172. The daily 38.2% Fib levels comes at 0.621, expected to provide resistance. Similarly, the daily 61.8% fib level is at 0.6233, expected to provide resistance.
Note the levels of interest below:
- Pivot support is noted at 0.615, 0.6111, 0.6051
- Pivot resistance is noted at 0.6249, 0.631, 0.6348
| Levels | Levels.1 |
|---|---|
| Previous Daily High | 0.6271 |
| Previous Daily Low | 0.6172 |
| Previous Weekly High | 0.6226 |
| Previous Weekly Low | 0.6084 |
| Previous Monthly High | 0.6538 |
| Previous Monthly Low | 0.6131 |
| Daily Fibonacci 38.2% | 0.6210 |
| Daily Fibonacci 61.8% | 0.6233 |
| Daily Pivot Point S1 | 0.6150 |
| Daily Pivot Point S2 | 0.6111 |
| Daily Pivot Point S3 | 0.6051 |
| Daily Pivot Point R1 | 0.6249 |
| Daily Pivot Point R2 | 0.6310 |
| Daily Pivot Point R3 | 0.6348 |
[/s2If]
Join Our Telegram Group
")


