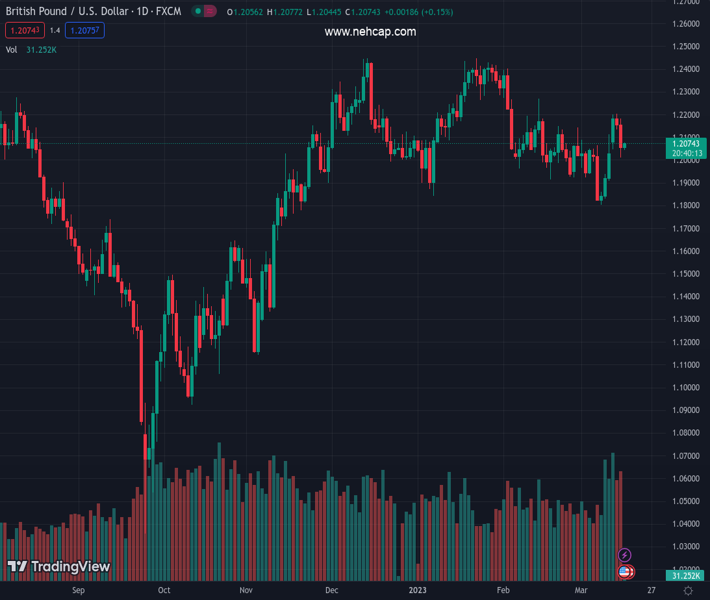
#GBPUSD @ 1.20755 has delivered a breakdown of the Inventory Distribution formed in the 1.2140-1.2200 range. (Pivot Orderbook analysis)
…
This is a premium post.
[s2If !current_user_can(access_s2member_level4)]Please register for PREMIUM VERSION HERE to read full post below containing analysis. In case of any error or you think you are not able to read the full post below, please email us at support#nehcap.com [lwa][/s2If] [s2If current_user_can(access_s2member_level4)]
- GBP/USD has delivered a breakdown of the Inventory Distribution formed in the 1.2140-1.2200 range.
- The 20-period EMA at 1.2081 will act as a barricade for the Pound Sterling.
- The BoE officials were in talks with counterparts, as they all raced to assess the potential impact of the Credit Suisse fiasco.
The pair currently trades last at 1.20755.
The previous day high was 1.2204 while the previous day low was 1.2136. The daily 38.2% Fib levels comes at 1.2162, expected to provide resistance. Similarly, the daily 61.8% fib level is at 1.2178, expected to provide resistance.
The GBP/USD pair has attempted a recovery move from the psychological support of 1.2000 in the early Asian session. The Cable witnessed a sell-off on Wednesday after reports citing internal ‘materialistic weaknesses’ in Credit Suisse spooked market sentiment. The release of the financial budget by United Kingdom Finance Minister (FM) Jeremy Hunt failed to provide a cushion to the Pound Sterling.
The US Dollar Index (DXY) has corrected after challenging the critical resistance of 105.00 as the release of weak United States Retail Sales and lower Producer Price Index (PPI) figures confirmed that the US inflation is meaningfully declining. This eased hawkish Federal Reserve (Fed) bets dramatically.
Meanwhile, Bank of England (BoE) officials were in talks with counterparts, as they all raced to assess the potential impact of the problems at Credit Suisse, a ‘systemically important’ institution that is enmeshed in the global financial system, as reported by the Telegraph. It further added that experts predicted that it will require a bailout to prevent a collapse that would rock banks and pension funds around the world.
On an hourly scale, GBP/USD has witnessed a breakdown after an Inventory Distribution in which inventory is transferred from institutional investors to the retail participants. The Cable has sensed a cushion plotted near 1.2020.
Going forward, the 20-period Exponential Moving Average (EMA) at 1.2081 will act as a barricade for the Pound Sterling.
The Relative Strength Index (RSI) (14) has climbed into the 40.00-60.00 range from the bearish range of 20.00-40.00. Usually, a power-pack action is followed by a volatility squeeze.
Should the Cable break below the psychological support of 1.2000, US Dollar bulls would drag the asset toward February 27 low at 1.1922, followed by March 08 low at 1.1803.
Alternatively, a move above February 21 high of around 1.2140 will drive the Cable toward March 14 high at 1.2203. A breach above the latter would expose the asset to the round-level resistance at 1.2300.
Technical Levels: Supports and Resistances
GBPUSD currently trading at 1.2066 at the time of writing. Pair opened at 1.2158 and is trading with a change of -0.76 % .
| Overview | Overview.1 | |
|---|---|---|
| 0 | Today last price | 1.2066 |
| 1 | Today Daily Change | -0.0092 |
| 2 | Today Daily Change % | -0.7600 |
| 3 | Today daily open | 1.2158 |
The pair is trading above its 20 Daily moving average @ 1.2015, below its 50 Daily moving average @ 1.2135 , above its 100 Daily moving average @ 1.2033 and above its 200 Daily moving average @ 1.1897
| Trends | Trends.1 | |
|---|---|---|
| 0 | Daily SMA20 | 1.2015 |
| 1 | Daily SMA50 | 1.2135 |
| 2 | Daily SMA100 | 1.2033 |
| 3 | Daily SMA200 | 1.1897 |
The previous day high was 1.2204 while the previous day low was 1.2136. The daily 38.2% Fib levels comes at 1.2162, expected to provide resistance. Similarly, the daily 61.8% fib level is at 1.2178, expected to provide resistance.
Note the levels of interest below:
- Pivot support is noted at 1.2128, 1.2097, 1.2059
- Pivot resistance is noted at 1.2196, 1.2235, 1.2265
| Levels | Levels.1 |
|---|---|
| Previous Daily High | 1.2204 |
| Previous Daily Low | 1.2136 |
| Previous Weekly High | 1.2114 |
| Previous Weekly Low | 1.1803 |
| Previous Monthly High | 1.2402 |
| Previous Monthly Low | 1.1915 |
| Daily Fibonacci 38.2% | 1.2162 |
| Daily Fibonacci 61.8% | 1.2178 |
| Daily Pivot Point S1 | 1.2128 |
| Daily Pivot Point S2 | 1.2097 |
| Daily Pivot Point S3 | 1.2059 |
| Daily Pivot Point R1 | 1.2196 |
| Daily Pivot Point R2 | 1.2235 |
| Daily Pivot Point R3 | 1.2265 |
[/s2If]
Join Our Telegram Group
")


