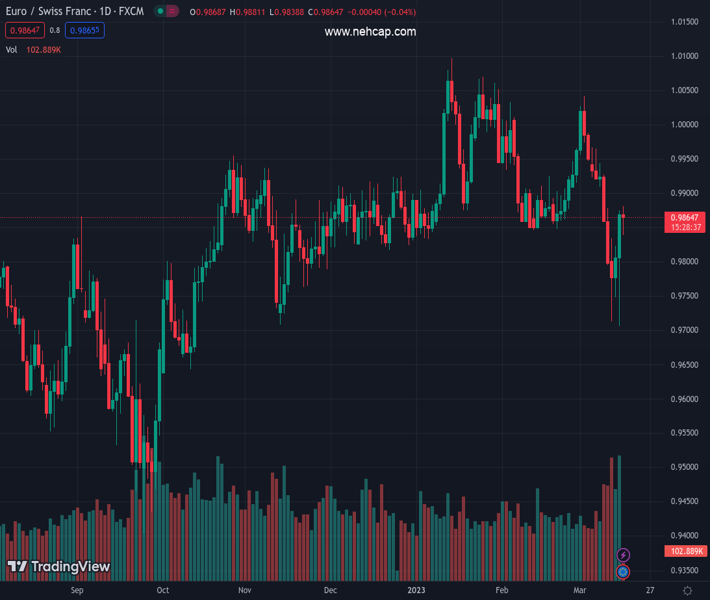
#EURCHF @ 0.98644 is demonstrating a back-and-forth action around 0.9860 ahead of ECB policy. (Pivot Orderbook analysis)
…
This is a premium post.
[s2If !current_user_can(access_s2member_level4)]Please register for PREMIUM VERSION HERE to read full post below containing analysis. In case of any error or you think you are not able to read the full post below, please email us at support#nehcap.com [lwa][/s2If] [s2If current_user_can(access_s2member_level4)]
- EUR/CHF is demonstrating a back-and-forth action around 0.9860 ahead of ECB policy.
- A Double Bottom pattern has activated after a breakout of critical resistance placed at 0.9834.
- The RSI (14) is oscillating in the bullish range of 60.00-80.00, which indicates more upside ahead.
The pair currently trades last at 0.98644.
The previous day high was 0.9875 while the previous day low was 0.9706. The daily 38.2% Fib levels comes at 0.9811, expected to provide support. Similarly, the daily 61.8% fib level is at 0.9771, expected to provide support.
The EUR/CHF pair is displaying a back-and-forth action around 0.9860 in the early European session. The cross has turned sideways after a perpendicular upside move and is expected to continue its upside momentum as the debacle of Credit Suisse is stretching further.
The Swiss National Bank (SNB) has promised an advance of 50bln Swiss Francs to Credit Suisse to support liquidity. However, the commentary from Credit Suisse chairman Axel Lehmann that state assistance “isn’t a topic” for the bank as it seeks to recover from a string of scandals that have undermined the confidence of investors and clients indicates that the impact will be huge going forward.
Meanwhile, investors are keenly awaiting the interest rate decision by the European Central Bank (ECB). ECB President Christine Lagarde is expected to continue its 50 basis points (bps) rate hike spell as Eurozone’s inflation is extremely stubborn.
EUR/CHF has delivered a break above the critical resistance plotted from March 13 high at 0.9834 on an hourly scale. This has activated the formation of a Double Bottom chart pattern and has cemented a bullish reversal.
The 20-period Exponential Moving Average (EMA) at 0.9839 might continue to provide support to the Euro bulls.
Meanwhile, the Relative Strength Index (RSI) (14) is oscillating in the bullish range of 60.00-80.00, which indicates more upside ahead.
Should the asset delivers a mean-reversion to the 20-EMA near 0.9839, a bargain buying opportunity will be triggered, which will drive the cross toward the round-level resistance at 0.9900, followed by October 27 high at 0.9955.
In an alternate scenario, a downside break below March 15 low at 0.9706 will drag the asset toward October 12 low at 0.9643 and September 13 low at 0.9584.
Technical Levels: Supports and Resistances
EURCHF currently trading at 0.9862 at the time of writing. Pair opened at 0.9872 and is trading with a change of -0.1 % .
| Overview | Overview.1 | |
|---|---|---|
| 0 | Today last price | 0.9862 |
| 1 | Today Daily Change | -0.0010 |
| 2 | Today Daily Change % | -0.1000 |
| 3 | Today daily open | 0.9872 |
The pair is trading below its 20 Daily moving average @ 0.9901, below its 50 Daily moving average @ 0.9932 , below its 100 Daily moving average @ 0.9895 and above its 200 Daily moving average @ 0.9856
| Trends | Trends.1 | |
|---|---|---|
| 0 | Daily SMA20 | 0.9901 |
| 1 | Daily SMA50 | 0.9932 |
| 2 | Daily SMA100 | 0.9895 |
| 3 | Daily SMA200 | 0.9856 |
The previous day high was 0.9875 while the previous day low was 0.9706. The daily 38.2% Fib levels comes at 0.9811, expected to provide support. Similarly, the daily 61.8% fib level is at 0.9771, expected to provide support.
Note the levels of interest below:
- Pivot support is noted at 0.976, 0.9649, 0.9592
- Pivot resistance is noted at 0.993, 0.9987, 1.0099
| Levels | Levels.1 |
|---|---|
| Previous Daily High | 0.9875 |
| Previous Daily Low | 0.9706 |
| Previous Weekly High | 0.9967 |
| Previous Weekly Low | 0.9795 |
| Previous Monthly High | 1.0033 |
| Previous Monthly Low | 0.9847 |
| Daily Fibonacci 38.2% | 0.9811 |
| Daily Fibonacci 61.8% | 0.9771 |
| Daily Pivot Point S1 | 0.9760 |
| Daily Pivot Point S2 | 0.9649 |
| Daily Pivot Point S3 | 0.9592 |
| Daily Pivot Point R1 | 0.9930 |
| Daily Pivot Point R2 | 0.9987 |
| Daily Pivot Point R3 | 1.0099 |
[/s2If]
Join Our Telegram Group
")


