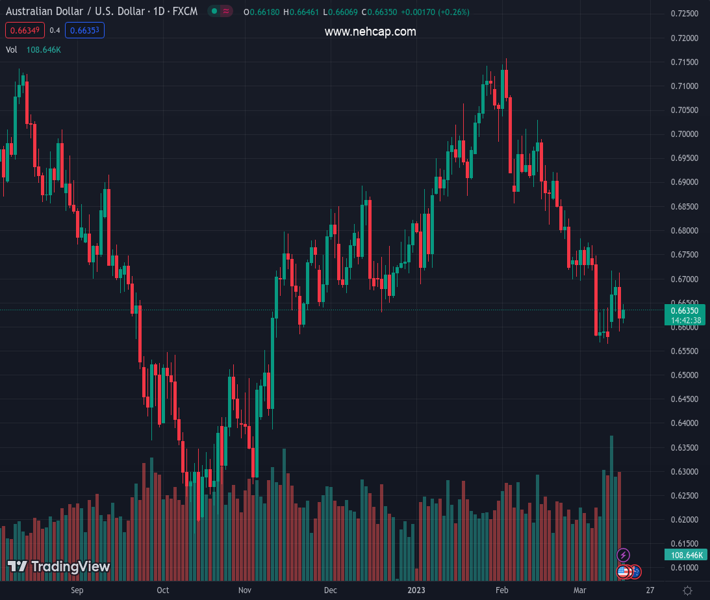
#AUDUSD @ 0.66378 has printed a fresh intraday high at 0.6645 as a correction in the USD Index has extended. (Pivot Orderbook analysis)
…
This is a premium post.
[s2If !current_user_can(access_s2member_level4)]Please register for PREMIUM VERSION HERE to read full post below containing analysis. In case of any error or you think you are not able to read the full post below, please email us at support#nehcap.com [lwa][/s2If] [s2If current_user_can(access_s2member_level4)]
- AUD/USD has printed a fresh intraday high at 0.6645 as a correction in the USD Index has extended.
- Federal Reserve might continue a 25 bps rate hike move as January’s upbeat US economic data was a one-time show.
- An upbeat Australian Employment data has propelled the odds of more rates announcements from the Reserve Bank of Australia.
- AUD/USD is consolidation near the critical support plotted from 0.6585.
The pair currently trades last at 0.66378.
The previous day high was 0.6712 while the previous day low was 0.659. The daily 38.2% Fib levels comes at 0.6636, expected to provide support. Similarly, the daily 61.8% fib level is at 0.6665, expected to provide resistance.
AUD/USD has printed a fresh intraday high at 0.6645 in the early European session amid upbeat Australian labor market data and extended correction from the US Dollar Index (DXY). The Aussie asset has stretched its recovery from below the round-level support of 0.6600 as investors are paring positions from the USD Index, backed by fears of the global banking crisis.
The US Dollar Index (DXY) has stretched its correction to near 104.40 as investors are shifting their focus on the uncertainty associated with an upcoming monetary policy from the Federal Reserve (Fed). On Wednesday, investors shifted their funds into the USD index to dodge volatility fueled by Credit Suisse’s fiasco.
S&P500 futures are holding significant gains generated in the Asian session after a sell-off on Wednesday, portraying a minor rebound in investors’ risk appetite. However, the overall market mood is quite risk-off. Fears of global financial instability propelled by the debacle of Credit Suisse have fueled demand for US government bonds. This has led to declining in the 10-year US Treasury yields to 3.48%.
A few days back, market participants were anticipating bigger rates announcement from the Federal Reserve (Fed) as January’s United States economic data conveyed the inflation outlook is extremely stubborn. However, the release of the downbeat US Retail Sales and lower-than-anticipated Producer Price Index (PPI) figures on Wednesday after softening of the Consumer Price Index (CPI) and the print of a higher Unemployment Rate have conveyed that January’s data was a one-time blip. This has cemented the odds of the continuation of smaller rate hikes. Also, fresh fears of banking sector turmoil have opened doors for a steady monetary policy.
Along with bringing down persistent inflation, restoring of investors’ confidence after the Silicon Valley Bank (SVB) collapse, has become an important Key Responsibility Area (KRA) for Fed chair Jerome Powell.
The release of the better-than-anticipated Australian Employment data has added to troubles for the Reserve Bank of Australia (RBA), which is devoting significant time to bringing down the elevated inflation. In February, the Australian economy added fresh 64.6K payrolls, significantly higher than the consensus of 48.5K. Investors should note that the Australian economy reported 11.5K lay-offs in January. The Unemployment Rate has been trimmed further to 3.5% from the estimates of 3.6% and the prior release of 3.7%.
This indicates that the labor demand is extremely solid and further requirements of talent will be offset by higher offerings from the firms. Escalating labor cost index is sufficient to fuel inflationary pressures further. RBA Governor Philip Lowe might continue to target more rates as a higher laborforce in action would result in spiking inflationary pressures further.
Earlier, Australian Consumer Inflation Expectations (Mar) data that demonstrate inflation projections for the next 12 months dropped to 5.0% from the consensus of 5.4% and the former release of 5.1%. The impact of lower consumer inflation expectations looks to fade after solid Australian labor market data.
AUD/USD is oscillating in a broader range of 0.6548-0.6718 on a daily scale. The Aussie asset has turned sideways after drifting to near the horizontal support plotted from November 14 low at 0.6585. The 20-period Exponential Moving Average (EMA) at 0.6713 is barricading the Aussie bulls.
Failure by the Relative Strength Index (RSI) (14) in shifting into the 40.00-60.00 range indicates more downside is in pipeline.
Technical Levels: Supports and Resistances
AUDUSD currently trading at 0.664 at the time of writing. Pair opened at 0.6619 and is trading with a change of 0.32 % .
| Overview | Overview.1 | |
|---|---|---|
| 0 | Today last price | 0.6640 |
| 1 | Today Daily Change | 0.0021 |
| 2 | Today Daily Change % | 0.3200 |
| 3 | Today daily open | 0.6619 |
The pair remains strongly bearish on the daily time frame. It trades below the 20 SMA @ 0.6732, 50 SMA 0.6876, 100 SMA @ 0.6773 and 200 SMA @ 0.6769.
| Trends | Trends.1 | |
|---|---|---|
| 0 | Daily SMA20 | 0.6732 |
| 1 | Daily SMA50 | 0.6876 |
| 2 | Daily SMA100 | 0.6773 |
| 3 | Daily SMA200 | 0.6769 |
The previous day high was 0.6712 while the previous day low was 0.659. The daily 38.2% Fib levels comes at 0.6636, expected to provide support. Similarly, the daily 61.8% fib level is at 0.6665, expected to provide resistance.
Note the levels of interest below:
- Pivot support is noted at 0.6569, 0.6518, 0.6447
- Pivot resistance is noted at 0.669, 0.6762, 0.6812
| Levels | Levels.1 |
|---|---|
| Previous Daily High | 0.6712 |
| Previous Daily Low | 0.6590 |
| Previous Weekly High | 0.6770 |
| Previous Weekly Low | 0.6564 |
| Previous Monthly High | 0.7158 |
| Previous Monthly Low | 0.6698 |
| Daily Fibonacci 38.2% | 0.6636 |
| Daily Fibonacci 61.8% | 0.6665 |
| Daily Pivot Point S1 | 0.6569 |
| Daily Pivot Point S2 | 0.6518 |
| Daily Pivot Point S3 | 0.6447 |
| Daily Pivot Point R1 | 0.6690 |
| Daily Pivot Point R2 | 0.6762 |
| Daily Pivot Point R3 | 0.6812 |
[/s2If]
Join Our Telegram Group
")


