#XAGUSD @ 21.733 clings to Wednesday’s gains of 0.36%, despite overall US Dollar strength. (Pivot Orderbook analysis)
…
This is a premium post.
[s2If !current_user_can(access_s2member_level4)]Please register for PREMIUM VERSION HERE to read full post below containing analysis. In case of any error or you think you are not able to read the full post below, please email us at support#nehcap.com [lwa][/s2If] [s2If current_user_can(access_s2member_level4)]
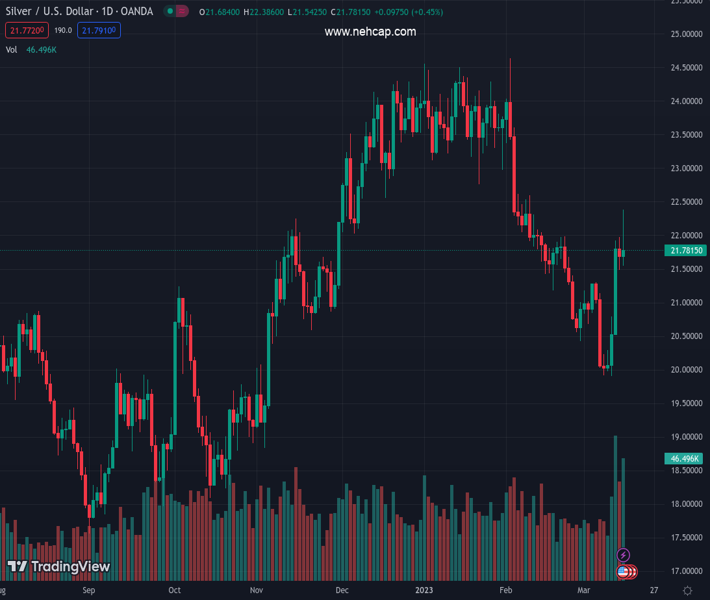
- XAG/USD clings to Wednesday’s gains of 0.36%, despite overall US Dollar strength.
- Silver dropped below the 200-day EMAs after reaching a daily high of $22.37.
- XAG/USD Price Analysis: Silver remains downward biased.
The pair currently trades last at 21.733.
The previous day high was 21.98 while the previous day low was 21.48. The daily 38.2% Fib levels comes at 21.67, expected to provide support. Similarly, the daily 61.8% fib level is at 21.78, expected to provide resistance.
Silver price retraced some of its earlier gains after hitting a daily high of $22.37; a slight improvement in market sentiment strengthened the US Dollar (USD). Therefore, the XAG/USD is trading at $21.75, above its opening price by 0.36%, below the 200-day Exponential Moving Average (EMA).
After reaching a daily high, the XAG/USD retreated from levels around $22.30s and cleared the confluence of the 50, 100, and 200-day EMAs at around $21.79-86. Therefore, the bearish bias remains intact, as the XAG/USD is set to achieve a daily close below the 200-day EMA.
Although oscillators shifted bullish, price action is the leading indicator. The Relative Strength Index (RSI) turned flat in bullish territory, while the Rate of Change (RoC) portrays buying pressure is waning. Therefore, the XAG/USD would remain trading sideways in the near term.
For a bearish resumption, the XAG/USD needs to crack the March 14 low of $21.50. A breach of the latter will expose the February 17 daily low at $21.18, followed by the November 28 swing low at 20.87. Once those two areas are reclaimed, the YTD low would be for grabs.
In an alternate scenario, the XAG/USD first resistance would be the confluence of the 200/100/50-day EMAs, around $21.79-86. Once buyers reclaim that area, the $22.00 figure would be up for grabs, before testing the weekly high of $22.37.
Technical Levels: Supports and Resistances
XAGUSD currently trading at 21.78 at the time of writing. Pair opened at 21.7 and is trading with a change of 0.37 % .
| Overview | Overview.1 | |
|---|---|---|
| 0 | Today last price | 21.78 |
| 1 | Today Daily Change | 0.08 |
| 2 | Today Daily Change % | 0.37 |
| 3 | Today daily open | 21.70 |
The pair is trading above its 20 Daily moving average @ 21.11, below its 50 Daily moving average @ 22.43 , below its 100 Daily moving average @ 22.25 and above its 200 Daily moving average @ 20.94
| Trends | Trends.1 | |
|---|---|---|
| 0 | Daily SMA20 | 21.11 |
| 1 | Daily SMA50 | 22.43 |
| 2 | Daily SMA100 | 22.25 |
| 3 | Daily SMA200 | 20.94 |
The previous day high was 21.98 while the previous day low was 21.48. The daily 38.2% Fib levels comes at 21.67, expected to provide support. Similarly, the daily 61.8% fib level is at 21.78, expected to provide resistance.
Note the levels of interest below:
- Pivot support is noted at 21.46, 21.22, 20.96
- Pivot resistance is noted at 21.96, 22.22, 22.46
| Levels | Levels.1 |
|---|---|
| Previous Daily High | 21.98 |
| Previous Daily Low | 21.48 |
| Previous Weekly High | 21.31 |
| Previous Weekly Low | 19.90 |
| Previous Monthly High | 24.64 |
| Previous Monthly Low | 20.42 |
| Daily Fibonacci 38.2% | 21.67 |
| Daily Fibonacci 61.8% | 21.78 |
| Daily Pivot Point S1 | 21.46 |
| Daily Pivot Point S2 | 21.22 |
| Daily Pivot Point S3 | 20.96 |
| Daily Pivot Point R1 | 21.96 |
| Daily Pivot Point R2 | 22.22 |
| Daily Pivot Point R3 | 22.46 |
[/s2If]
Join Our Telegram Group
")


