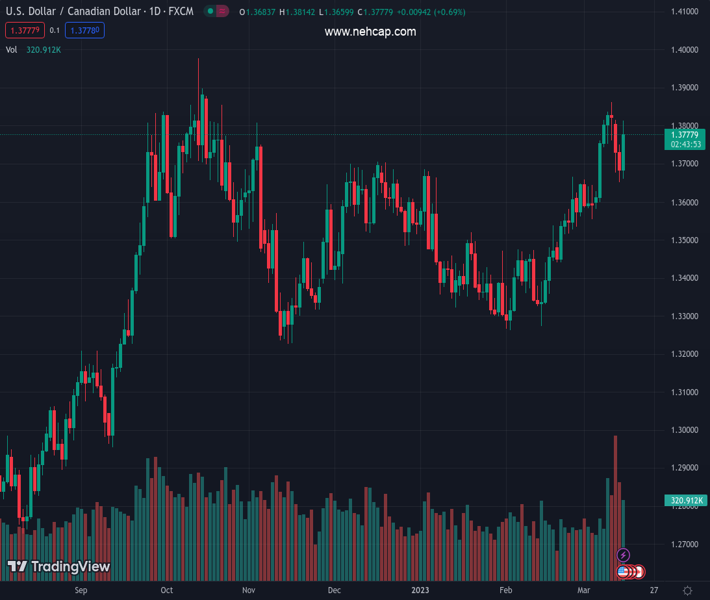
#USDCAD @ 1.37767 climbs on market sentiment deterioration, as investors seeking safety bolstered the US Dollar. (Pivot Orderbook analysis)
…
This is a premium post.
[s2If !current_user_can(access_s2member_level4)]Please register for PREMIUM VERSION HERE to read full post below containing analysis. In case of any error or you think you are not able to read the full post below, please email us at support#nehcap.com [lwa][/s2If] [s2If current_user_can(access_s2member_level4)]
- USD/CAD climbs on market sentiment deterioration, as investors seeking safety bolstered the US Dollar.
- US Retail Sales were lower than expected, but prices paid by producers cooled.
- USD/CAD Price Analysis: To resume its uptrend, buyers are eyeing 1.3900.
The pair currently trades last at 1.37767.
The previous day high was 1.375 while the previous day low was 1.3652. The daily 38.2% Fib levels comes at 1.3689, expected to provide support. Similarly, the daily 61.8% fib level is at 1.3713, expected to provide support.
USD/CAD rallies on safe-haven flows towards the greenback sponsored by the US financial banking crisis woes threatening to spread around the globe. The failure of two banks in the United States (US) spurred a sell-off in Credit Suisse’s (CS) stock, amongst increasing fears of a financial crisis. Therefore, the USD/CAD is trading at 1.3774 after hitting a low of 1.3659.
Investors’ mood remains deteriorated, as shown by global equities treading water. Wall Street continues to trade with losses amidst a possible default by Credit Suisse, as more banks take less exposure to the latter. The CBOE Volatility Index (VIX), known as the fear index, shot up and reached the 30.00 level, portraying the sour sentiment in the financial markets.
In the meantime, economic data from the United States (US) witnessed Retail Sales plunging 0.4% MoM vs. estimates of 0.3% contraction. Even though it’s a negative print, January’s 3.2% jump and February’s data still show that Americans are spending at a slower pace. At the same time, the US Bureau of Labor Statistics revealed that prices paid by producers in February, also known as the Producer Price Index (PPI), dropped 0.1% MoM, beneath forecasts of 0.3% expansion. Core PPI was 0%, below estimates for a 0.4% increase, showing signs that prices are heading downwards amidst the Fed’s aggressive tightening cycle of 20220.
Therefore, safe-haven flows bolstered the US Dollar (USD), with the US Dollar index advancing 1.13%, at 104.836. However, US Treasury bond yields have been punished by investors, with US 2s and 10s extending their losses, each down by 37 basis points (bps) and 24 bps, respectively, at 3.889% and 3.453%.
On the Canadian side, Housing Starts in February exceeded estimates of 220K, rising to 224K units from 216.5K revised in January, according to the Canadian Mortgage and Housing Corporation (CMHC).
Therefore, the USD/CAD would remain underpinned by market sentiment and flows toward safety. In addition, the Bank of Canada (BoC) pausing interest rate increases would keep the US Dollar underpinned by the interest rate differential. This means the USD/CAD bias remains upwards.
The USD/CAD is still upward biased, snapping three days of consecutive losses. Although the pair tested the 20-day Exponential Moving Average (EMA) at 1.3645, it jumped from that area and formed a bullish engulfing candle chart pattern. Oscillators remain in bullish territory, except for the Rate of Change (RoC), which shows that selling pressure is waning, about to cross above neutral.
In case of a bullish continuation, the USD/CAD first resistance would be 1.3814, today’s high. A breach of the latter will expose the YTD high at 1.3862 before the pair edges to 1.3900. As an alternate scenario, the USD/CAD cracking the 20-day EMA at 1.3645 would pave the way toward the 50-day EMA At 1.3550.
Technical Levels: Supports and Resistances
USDCAD currently trading at 1.3771 at the time of writing. Pair opened at 1.3685 and is trading with a change of 0.63 % .
| Overview | Overview.1 | |
|---|---|---|
| 0 | Today last price | 1.3771 |
| 1 | Today Daily Change | 0.0086 |
| 2 | Today Daily Change % | 0.6300 |
| 3 | Today daily open | 1.3685 |
The pair remains strongly bullish on the daily timeframe. It trades above its 20 SMA @ 1.3613, 50 SMA 1.3483, 100 SMA @ 1.3505 and 200 SMA @ 1.3324.
| Trends | Trends.1 | |
|---|---|---|
| 0 | Daily SMA20 | 1.3613 |
| 1 | Daily SMA50 | 1.3483 |
| 2 | Daily SMA100 | 1.3505 |
| 3 | Daily SMA200 | 1.3324 |
The previous day high was 1.375 while the previous day low was 1.3652. The daily 38.2% Fib levels comes at 1.3689, expected to provide support. Similarly, the daily 61.8% fib level is at 1.3713, expected to provide support.
Note the levels of interest below:
- Pivot support is noted at 1.3641, 1.3597, 1.3543
- Pivot resistance is noted at 1.374, 1.3794, 1.3838
| Levels | Levels.1 |
|---|---|
| Previous Daily High | 1.3750 |
| Previous Daily Low | 1.3652 |
| Previous Weekly High | 1.3862 |
| Previous Weekly Low | 1.3582 |
| Previous Monthly High | 1.3666 |
| Previous Monthly Low | 1.3262 |
| Daily Fibonacci 38.2% | 1.3689 |
| Daily Fibonacci 61.8% | 1.3713 |
| Daily Pivot Point S1 | 1.3641 |
| Daily Pivot Point S2 | 1.3597 |
| Daily Pivot Point S3 | 1.3543 |
| Daily Pivot Point R1 | 1.3740 |
| Daily Pivot Point R2 | 1.3794 |
| Daily Pivot Point R3 | 1.3838 |
[/s2If]
Join Our Telegram Group
")


