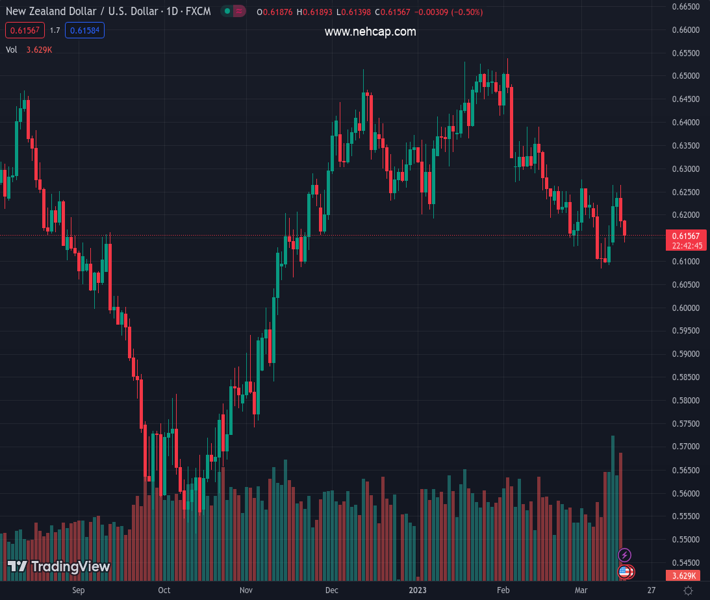
#NZDUSD @ 0.61569 has dropped sharply below 0.6160 on weaker NZ GDP figures. (Pivot Orderbook analysis)
…
This is a premium post.
[s2If !current_user_can(access_s2member_level4)]Please register for PREMIUM VERSION HERE to read full post below containing analysis. In case of any error or you think you are not able to read the full post below, please email us at support#nehcap.com [lwa][/s2If] [s2If current_user_can(access_s2member_level4)]
- NZD/USD has dropped sharply below 0.6160 on weaker NZ GDP figures.
- A catastrophic collapse of Credit Suisse forced investors to shift their funds into the USD Index.
- Fed Powell might consider a pause in the policy-tightening spell considering the deceleration in the US Inflation.
The pair currently trades last at 0.61569.
The previous day high was 0.6248 while the previous day low was 0.6198. The daily 38.2% Fib levels comes at 0.6229, expected to provide resistance. Similarly, the daily 61.8% fib level is at 0.6217, expected to provide resistance.
The NZD/USD pair has slipped firmer below 0.6160 as Statistics New Zealand has reported weak Gross Domestic Product (Q4) data. The economy contracted by 0.6% in the fourth quarter while the street was expecting a contraction of 0.2%. The New Zealand economy showed a growth rate of 1.7%.
On an annual basis, the NZ economy has expanded by 2.2%, lower than the estimates of 3.3% and the former release of 6.7%. A deteriorating economy demonstrates weakness in overall demand, which would also reduce inflationary pressures. In times when NZ inflation is extremely stubborn, the headline of economic contraction would delight the Reserve Bank of New Zealand (RBNZ).
The Kiwi asset remained solid on early Tuesday as China’s Retail Sales data justified the expectations from the street and the US Dollar Index (DXY) was beaten down by the declining United States Consumer Price Index (CPI) and the collapse of Silicon Valley Bank (SVB).
However, the ‘material weakness’ in internal controls of Credit Suisse’s financial reporting triggered demand for safe-haven assets. The stretch of banking system failure from the US to Europe deepened fears among market participants and they shift back to the USD Index to dodge liquidity.
A blunt decline by the Saudi National Bank for infusing more funds into Credit Suisse, the leading investor in the Swiss banking firm, raised alarms of some internal financial issues, which led to a nosedive move in the share price of Credit Suisse.
S&P500 futures failed to continue Tuesday’s upbeat recovery and were heavily sold by investors, portraying a risk-aversion theme. The demand for US government bonds rose dramatically as investors gung-ho for safe-haven appeal. This led to a sheer decline in the 10-year US Treasury yields to 3.46%.
Meanwhile, the odds for a 50 basis point (bps) interest rate hike by the Federal Reserve (Fed) has faded as US Producer Price Index (PPI) dropped lower than expected and Retail Sales contracted more than anticipation. There is no denying the fact that Fed chair Jerome Powell could also consider a pause in the policy-tightening spell considering the deceleration in the US Inflation and huge stress on the financial system.
Technical Levels: Supports and Resistances
NZDUSD currently trading at 0.6161 at the time of writing. Pair opened at 0.6237 and is trading with a change of -1.22 % .
| Overview | Overview.1 | |
|---|---|---|
| 0 | Today last price | 0.6161 |
| 1 | Today Daily Change | -0.0076 |
| 2 | Today Daily Change % | -1.2200 |
| 3 | Today daily open | 0.6237 |
The pair remains strongly bearish on the daily time frame. It trades below the 20 SMA @ 0.6201, 50 SMA 0.6317, 100 SMA @ 0.625 and 200 SMA @ 0.6165.
| Trends | Trends.1 | |
|---|---|---|
| 0 | Daily SMA20 | 0.6201 |
| 1 | Daily SMA50 | 0.6317 |
| 2 | Daily SMA100 | 0.6250 |
| 3 | Daily SMA200 | 0.6165 |
The previous day high was 0.6248 while the previous day low was 0.6198. The daily 38.2% Fib levels comes at 0.6229, expected to provide resistance. Similarly, the daily 61.8% fib level is at 0.6217, expected to provide resistance.
Note the levels of interest below:
- Pivot support is noted at 0.6207, 0.6177, 0.6157
- Pivot resistance is noted at 0.6257, 0.6278, 0.6308
| Levels | Levels.1 |
|---|---|
| Previous Daily High | 0.6248 |
| Previous Daily Low | 0.6198 |
| Previous Weekly High | 0.6226 |
| Previous Weekly Low | 0.6084 |
| Previous Monthly High | 0.6538 |
| Previous Monthly Low | 0.6131 |
| Daily Fibonacci 38.2% | 0.6229 |
| Daily Fibonacci 61.8% | 0.6217 |
| Daily Pivot Point S1 | 0.6207 |
| Daily Pivot Point S2 | 0.6177 |
| Daily Pivot Point S3 | 0.6157 |
| Daily Pivot Point R1 | 0.6257 |
| Daily Pivot Point R2 | 0.6278 |
| Daily Pivot Point R3 | 0.6308 |
[/s2If]
Join Our Telegram Group
")


