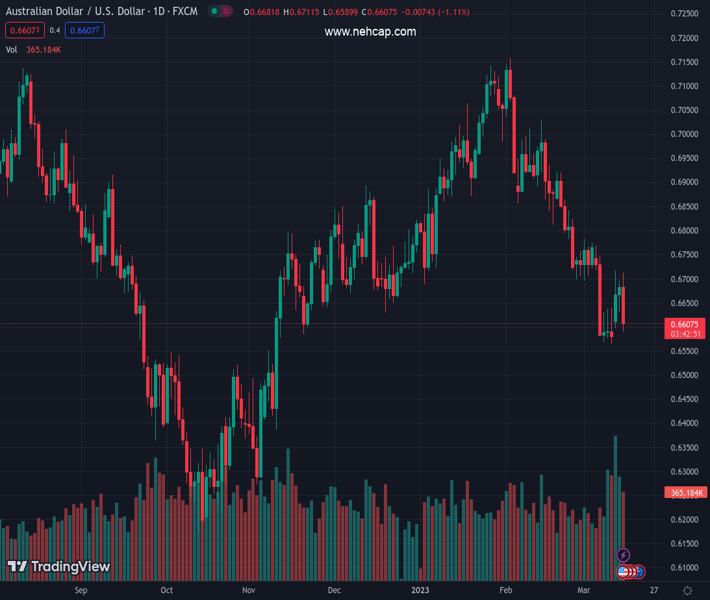
#AUDUSD @ 0.66073 struggles to hold above 0.6600 as risk aversion dominates (Pivot Orderbook analysis)
…
This is a premium post.
[s2If !current_user_can(access_s2member_level4)]Please register for PREMIUM VERSION HERE to read full post below containing analysis. In case of any error or you think you are not able to read the full post below, please email us at support#nehcap.com [lwa][/s2If] [s2If current_user_can(access_s2member_level4)]
The pair currently trades last at 0.66073.
The previous day high was 0.6696 while the previous day low was 0.6632. The daily 38.2% Fib levels comes at 0.6671, expected to provide resistance. Similarly, the daily 61.8% fib level is at 0.6656, expected to provide resistance.
AUD/USD faces selling pressure on Wednesday as investors turned risk-averse amid growing concerns about recent catastrophic developments relating to Credit Suisse just after the collapse of Silicon Valley Bank (SVB).
Aussie prints an intraday low of 0.6601 before settling at 0.6606, down 1.09% on Wednesday at the press time.
The Credit Suisse predicament and expectations of a 25-basis-point (bps) hike – albeit lower than previously forecast – by the Federal Reserve (Fed) in March are still driving up the US Dollar’s value.
The recent unsatisfactory macroeconomic reports from the US, which include a 0.1% decrease in the Producer Price Index (PPI) for February and a lower-than-expected core PPI rate, have not negatively impacted the US Dollar.
The US Retail Sales also falls by 0.4% in February, lower than the previous month’s 3.2% increase and the anticipated 0.3% drop. In addition, the New York Fed’s Empire State Manufacturing Index falls sharply to -24.6, below the predicted decrease to -8 from the previous -5.8.
However, concerns regarding a broader financial crisis continue to boost the US Dollar with safe-haven demand. Additionally, the Reserve Bank of Australia’s (RBA) dovish shift, indicating that it might be nearing the end of its rate-hiking cycle, indicates that the AUD/USD pair is likely to trend downwards.
Australia’s Employment Change s.a. (Feb) and Unemployment Rate s.a. (Feb), to be released at 00:30 GMT, is Thursday’s most critical vital data.
Additionally, traders will closely monitor the US Initial Job Claims data on Thursday at 12:30 GMT.
From a technical perspective, the AUD/USD pair remains in a downtrend, with the daily 20-SMA at 0.6747 acting as a significant resistance level.
Today’s high coincided with a major trendline joining the tops of the descending price trend since the start of February. The intraday decline that followed the retest of the trendline suggests the next move down in the bear trend may be unfolding. The March 10 lows are an obvious next target to the downside at 0.6565. A key support level also sits at 0.6580.
The daily 50-SMA at 0.6881 also adds to the downside pressure, indicating a bearish bias. The daily RSI(14) is currently at 36.970, suggesting that the pair is close to entering oversold territory, and there is an increased risk AUD/USD price may consolidate prior to further losses.
The pair’s intraday high of 0.6712 forms the immediate resistance, followed by the 38.2% Fibonacci level at 0.6671, the daily pivot point at 0.6670, and the resistance levels at 0.6709, 0.6735, and 0.6773.
Technical Levels: Supports and Resistances
AUDUSD currently trading at 0.6602 at the time of writing. Pair opened at 0.6683 and is trading with a change of -1.21 % .
| Overview | Overview.1 | |
|---|---|---|
| 0 | Today last price | 0.6602 |
| 1 | Today Daily Change | -0.0081 |
| 2 | Today Daily Change % | -1.2100 |
| 3 | Today daily open | 0.6683 |
The pair remains strongly bearish on the daily time frame. It trades below the 20 SMA @ 0.6747, 50 SMA 0.6881, 100 SMA @ 0.6771 and 200 SMA @ 0.6772.
| Trends | Trends.1 | |
|---|---|---|
| 0 | Daily SMA20 | 0.6747 |
| 1 | Daily SMA50 | 0.6881 |
| 2 | Daily SMA100 | 0.6771 |
| 3 | Daily SMA200 | 0.6772 |
The previous day high was 0.6696 while the previous day low was 0.6632. The daily 38.2% Fib levels comes at 0.6671, expected to provide resistance. Similarly, the daily 61.8% fib level is at 0.6656, expected to provide resistance.
Note the levels of interest below:
- Pivot support is noted at 0.6644, 0.6606, 0.658
- Pivot resistance is noted at 0.6709, 0.6735, 0.6773
| Levels | Levels.1 |
|---|---|
| Previous Daily High | 0.6696 |
| Previous Daily Low | 0.6632 |
| Previous Weekly High | 0.6770 |
| Previous Weekly Low | 0.6564 |
| Previous Monthly High | 0.7158 |
| Previous Monthly Low | 0.6698 |
| Daily Fibonacci 38.2% | 0.6671 |
| Daily Fibonacci 61.8% | 0.6656 |
| Daily Pivot Point S1 | 0.6644 |
| Daily Pivot Point S2 | 0.6606 |
| Daily Pivot Point S3 | 0.6580 |
| Daily Pivot Point R1 | 0.6709 |
| Daily Pivot Point R2 | 0.6735 |
| Daily Pivot Point R3 | 0.6773 |
[/s2If]
Join Our Telegram Group
")


