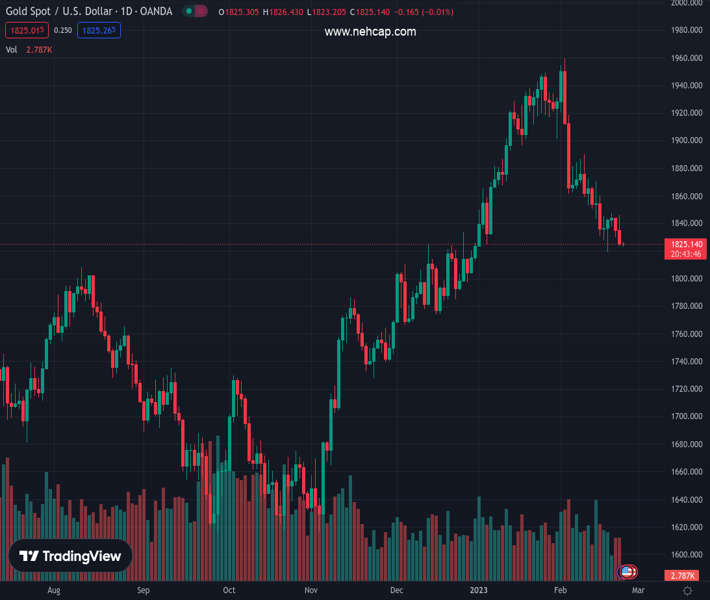
#XAUUSD @ 1,825.68 Gold price is eyeing more downside to near $1,820.00 amid hawkish FOMC minutes. (Pivot Orderbook analysis)
…
This is a premium post.
[s2If !current_user_can(access_s2member_level4)]Please register for PREMIUM VERSION HERE to read full post below containing analysis. In case of any error or you think you are not able to read the full post below, please email us at support#nehcap.com [lwa][/s2If] [s2If current_user_can(access_s2member_level4)]
- Gold price is eyeing more downside to near $1,820.00 amid hawkish FOMC minutes.
- FOMC minutes state China’s reopening and the Russia-Ukraine war still hold the risk of further escalation in inflation.
- Gold price is auctioning in an Inverted Flag, which is a bearish trend continuation pattern.
The pair currently trades last at 1825.68.
The previous day high was 1846.11 while the previous day low was 1823.63. The daily 38.2% Fib levels comes at 1832.22, expected to provide resistance. Similarly, the daily 61.8% fib level is at 1837.52, expected to provide resistance.
Gold price (XAU/USD) is displaying a sideways auction around $1,825.00 in the Asian session. The precious metal has turned sideways after a vertical sell-off and is expected to continue its downside to $1,820.00 as the Federal Open Market Committee (FOMC) minutes are conveying more rates to tame stubborn inflation.
The US Dollar Index (DXY) is aiming to recapture the weekly resistance of 104.33 as further policy restrictions to bring down inflation cannot be ruled out. S&P500 futures are demonstrating some gains in the Tokyo session after a choppy Wednesday, portraying a minor recovery in the risk appetite of the market participants. The return delivered on the 10-year US Treasury yields is marginally dropped to near 3.92%.
The minutes of the Federal Reserve (Fed)’s February monetary policy meeting explain inflation to be persistent as the reopening of China’s economy and the Russia-Ukraine war still hold the risk of further escalation in the price index. Meanwhile, St. Louis Fed President James Bullard has supported an aggressive monetary policy ahead. Fed policymaker sees the terminal rate at around 5.4%.
For further guidance, United States Gross Domestic Product (GDP) (Q4) data will remain in the spotlight. The annualized GDP data is seen unchanged at 2.9%. Economic activities in the US have remained contracting in the past few months. Therefore, the US GDP could deliver a downside surprise.
Gold price is forming an Inverted Flag chart pattern, which is a bearish trend-following pattern. The pattern formation is near the horizontal support plotted from December 13 high at $1,824.55 on a four-hour scale. The chart pattern indicates a sheer consolidation that is followed by a breakdown. Usually, the consolidation phase of the chart pattern serves as an inventory adjustment in which those participants initiate shorts, which prefer to enter an auction after the establishment of a bearish bias.
The 50-period Exponential Moving Average (EMA) at $1,844.00 is acting as a major barricade for the Gold bulls.
Also, the Relative Strength Index (RSI) (14) has slipped into the bearish range of 20.00-40.00, which indicates more weakness ahead.
Technical Levels: Supports and Resistances
XAUUSD currently trading at 1824.58 at the time of writing. Pair opened at 1824.86 and is trading with a change of -0.02 % .
| Overview | Overview.1 | |
|---|---|---|
| 0 | Today last price | 1824.58 |
| 1 | Today Daily Change | -0.28 |
| 2 | Today Daily Change % | -0.02 |
| 3 | Today daily open | 1824.86 |
The pair is trading below its 20 Daily moving average @ 1875.26, below its 50 Daily moving average @ 1864.05 , above its 100 Daily moving average @ 1790.08 and above its 200 Daily moving average @ 1776.28
| Trends | Trends.1 | |
|---|---|---|
| 0 | Daily SMA20 | 1875.26 |
| 1 | Daily SMA50 | 1864.05 |
| 2 | Daily SMA100 | 1790.08 |
| 3 | Daily SMA200 | 1776.28 |
The previous day high was 1846.11 while the previous day low was 1823.63. The daily 38.2% Fib levels comes at 1832.22, expected to provide resistance. Similarly, the daily 61.8% fib level is at 1837.52, expected to provide resistance.
Note the levels of interest below:
- Pivot support is noted at 1816.96, 1809.05, 1794.48
- Pivot resistance is noted at 1839.44, 1854.01, 1861.92
| Levels | Levels.1 |
|---|---|
| Previous Daily High | 1846.11 |
| Previous Daily Low | 1823.63 |
| Previous Weekly High | 1870.71 |
| Previous Weekly Low | 1818.93 |
| Previous Monthly High | 1949.27 |
| Previous Monthly Low | 1823.76 |
| Daily Fibonacci 38.2% | 1832.22 |
| Daily Fibonacci 61.8% | 1837.52 |
| Daily Pivot Point S1 | 1816.96 |
| Daily Pivot Point S2 | 1809.05 |
| Daily Pivot Point S3 | 1794.48 |
| Daily Pivot Point R1 | 1839.44 |
| Daily Pivot Point R2 | 1854.01 |
| Daily Pivot Point R3 | 1861.92 |
[/s2If]
Join Our Telegram Group
")


