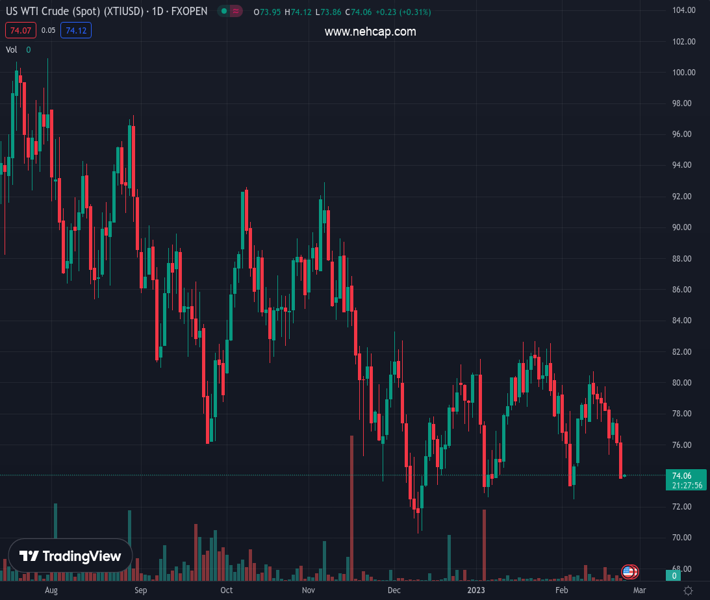
WTI is juggling below $74.00 after a nosedive move due to a huge build-up of US oil stockpiles. (Pivot Orderbook analysis)
…
This is a premium post.
[s2If !current_user_can(access_s2member_level4)]Please register for PREMIUM VERSION HERE to read full post below containing analysis. In case of any error or you think you are not able to read the full post below, please email us at support#nehcap.com [lwa][/s2If] [s2If current_user_can(access_s2member_level4)]
- WTI is juggling below $74.00 after a nosedive move due to a huge build-up of US oil stockpiles.
- Hawkish Fed minutes have accelerated the risk of a recession in the United States.
- The oil price might remain on the tenterhooks as a Head and Shoulder pattern is in formation.
The pair currently trades last at 74.13.
The previous day high was 76.58 while the previous day low was 73.86. The daily 38.2% Fib levels comes at 74.9, expected to provide resistance. Similarly, the daily 61.8% fib level is at 75.54, expected to provide resistance.
West Texas Intermediate (WTI), futures on NYMEX, have been dumped by the market participants after the United States American Petroleum Institute (API) reported a huge build-up of oil inventories for the week ending February 17.
The US API reported a build-up of oil stockpiles by 9.985 million barrels. This signifies exceeding oil supply against the overall demand, which resulted in a nosedive move of around 4%.
Apart from that, hawkish Federal Open Market Committee (FOMC) minutes have bolstered further slowdown in the economic activities in the United States. Firms are still struggling to address higher interest obligations and now further jump in the interest rates will result in more contraction in the scale of activities. Fed policymakers have favored for higher rates for a longer period to bring down inflation meaningfully.
Meanwhile, St. Louis Federal Reserve (Fed) President James Bullard has advocated an aggressive interest rate hike in the March monetary policy meeting to sharpen its tools in the battle against persistent inflation. This might escalate recession fears in the United States and eventually the oil demand. Further, the Fed policymaker sees the terminal rate as around 5.4%.
WTI is forming a Head and Shoulder chart pattern on a four-hour scale that indicates a breakdown of a prolonged consolidation. The right shoulder formation of the aforementioned chart pattern in under process and a complete formation will advocate more shorts on the oil price. The neckline of the chart pattern is plotted from January 5 low at $72.64.
The Relative Strength Index (RSI) (14) has slipped into the bearish range of 20.00-40.00, which indicates that the downside momentum is active.
Technical Levels: Supports and Resistances
XTIUSD currently trading at 74.13 at the time of writing. Pair opened at 73.94 and is trading with a change of 0.26 % .
| Overview | Overview.1 | |
|---|---|---|
| 0 | Today last price | 74.13 |
| 1 | Today Daily Change | 0.19 |
| 2 | Today Daily Change % | 0.26 |
| 3 | Today daily open | 73.94 |
The pair remains strongly bearish on the daily time frame. It trades below the 20 SMA @ 77.65, 50 SMA 77.99, 100 SMA @ 80.54 and 200 SMA @ 88.93.
| Trends | Trends.1 | |
|---|---|---|
| 0 | Daily SMA20 | 77.65 |
| 1 | Daily SMA50 | 77.99 |
| 2 | Daily SMA100 | 80.54 |
| 3 | Daily SMA200 | 88.93 |
The previous day high was 76.58 while the previous day low was 73.86. The daily 38.2% Fib levels comes at 74.9, expected to provide resistance. Similarly, the daily 61.8% fib level is at 75.54, expected to provide resistance.
Note the levels of interest below:
- Pivot support is noted at 73.0, 72.07, 70.28
- Pivot resistance is noted at 75.72, 77.51, 78.45
| Levels | Levels.1 |
|---|---|
| Previous Daily High | 76.58 |
| Previous Daily Low | 73.86 |
| Previous Weekly High | 80.75 |
| Previous Weekly Low | 75.34 |
| Previous Monthly High | 82.68 |
| Previous Monthly Low | 72.64 |
| Daily Fibonacci 38.2% | 74.90 |
| Daily Fibonacci 61.8% | 75.54 |
| Daily Pivot Point S1 | 73.00 |
| Daily Pivot Point S2 | 72.07 |
| Daily Pivot Point S3 | 70.28 |
| Daily Pivot Point R1 | 75.72 |
| Daily Pivot Point R2 | 77.51 |
| Daily Pivot Point R3 | 78.45 |
[/s2If]
Join Our Telegram Group
")


