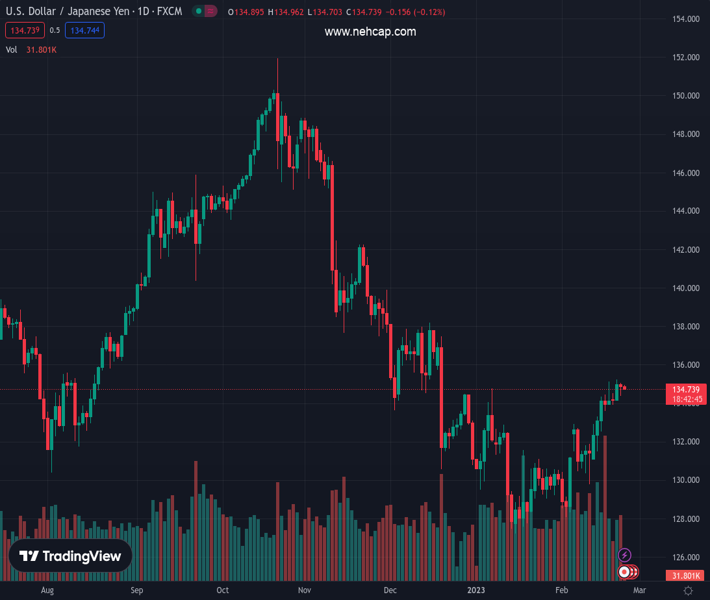
#USDJPY @ 134.738 takes offers to refresh intraday low, snaps four-day uptrend inside bearish chart formation., @nehcap view: Limited downside expected (Pivot Orderbook analysis)
…
This is a premium post.
[s2If !current_user_can(access_s2member_level4)]Please register for PREMIUM VERSION HERE to read full post below containing analysis. In case of any error or you think you are not able to read the full post below, please email us at support#nehcap.com [lwa][/s2If] [s2If current_user_can(access_s2member_level4)]
- USD/JPY takes offers to refresh intraday low, snaps four-day uptrend inside bearish chart formation.
- 100-HMA joins sluggish oscillators to raise barriers for seller’s entry around 134.50.
- Recovery remains elusive below 135.35; bears have a bumpy road to travel.
The pair currently trades last at 134.738.
The previous day high was 135.06 while the previous day low was 134.37. The daily 38.2% Fib levels comes at 134.8, expected to provide resistance. Similarly, the daily 61.8% fib level is at 134.63, expected to provide support.
USD/JPY renews intraday low near 134.70 during early Thursday as it prints the first daily loss in five heading into the European session. In doing so, the Yen pair remains depressed inside a one-week-old rising wedge bearish chart formation.
That said, the latest RSI (14) retreat and multiple failures to remain firmer past 135.00 tease the USD/JPY sellers. However, sluggish RSI and MACD suggest low support for the bears.
It’s worth noting that the 100-Hour Moving Average (HMA) joins the support line of the stated wedge to highlight the 134.50 as the short-term key support.
Following that, the 200-HMA and a fortnight-long horizontal line, respectively near 133.80 and 132.90, could challenge the USD/JPY downside.
In a case where the USD/JPY prices remain weak past 132.90, an ascending support line from February 02, close to 132.35 at the latest, appears as the last defense of the buyers.
On the flip side, recovery moves need to stay successfully beyond the 135.00 round figure to convince USD/JPY buyers.
Even so, the aforementioned wedge’s top line could challenge the upside momentum near 135.35 before giving control to the bulls.
Overall, USD/JPY is likely to decline further but the downside room appears limited.
Trend: Limited downside expected
Technical Levels: Supports and Resistances
USDJPY currently trading at 134.75 at the time of writing. Pair opened at 134.94 and is trading with a change of -0.14% % .
| Overview | Overview.1 | |
|---|---|---|
| 0 | Today last price | 134.75 |
| 1 | Today Daily Change | -0.19 |
| 2 | Today Daily Change % | -0.14% |
| 3 | Today daily open | 134.94 |
The pair is trading above its 20 Daily moving average @ 131.96, above its 50 Daily moving average @ 131.86 , below its 100 Daily moving average @ 137.36 and below its 200 Daily moving average @ 137.01
| Trends | Trends.1 | |
|---|---|---|
| 0 | Daily SMA20 | 131.96 |
| 1 | Daily SMA50 | 131.86 |
| 2 | Daily SMA100 | 137.36 |
| 3 | Daily SMA200 | 137.01 |
The previous day high was 135.06 while the previous day low was 134.37. The daily 38.2% Fib levels comes at 134.8, expected to provide resistance. Similarly, the daily 61.8% fib level is at 134.63, expected to provide support.
Note the levels of interest below:
- Pivot support is noted at 134.52, 134.1, 133.83
- Pivot resistance is noted at 135.21, 135.48, 135.91
| Levels | Levels.1 |
|---|---|
| Previous Daily High | 135.06 |
| Previous Daily Low | 134.37 |
| Previous Weekly High | 135.11 |
| Previous Weekly Low | 131.27 |
| Previous Monthly High | 134.78 |
| Previous Monthly Low | 127.22 |
| Daily Fibonacci 38.2% | 134.80 |
| Daily Fibonacci 61.8% | 134.63 |
| Daily Pivot Point S1 | 134.52 |
| Daily Pivot Point S2 | 134.10 |
| Daily Pivot Point S3 | 133.83 |
| Daily Pivot Point R1 | 135.21 |
| Daily Pivot Point R2 | 135.48 |
| Daily Pivot Point R3 | 135.91 |
[/s2If]
Join Our Telegram Group
")


