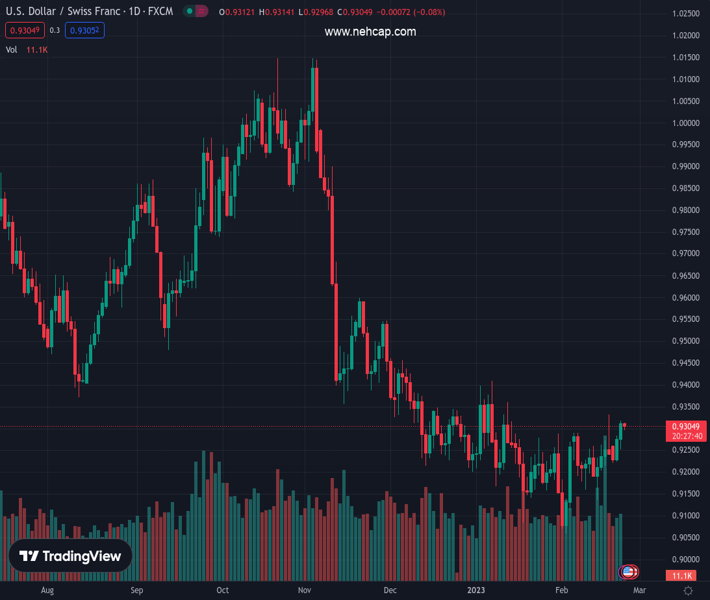
#USDCHF @ 0.93051 retreats from weekly top, snaps two-day winning streak. (Pivot Orderbook analysis)
…
This is a premium post.
[s2If !current_user_can(access_s2member_level4)]Please register for PREMIUM VERSION HERE to read full post below containing analysis. In case of any error or you think you are not able to read the full post below, please email us at support#nehcap.com [lwa][/s2If] [s2If current_user_can(access_s2member_level4)]
- USD/CHF retreats from weekly top, snaps two-day winning streak.
- Cautious optimism prevails as US President Biden thinks no imminent fears of nuclear use in Russia-Ukraine war.
- Easing US inflation expectations also favor pullback moves amid off in Japan.
The pair currently trades last at 0.93051.
The previous day high was 0.9319 while the previous day low was 0.9253. The daily 38.2% Fib levels comes at 0.9294, expected to provide support. Similarly, the daily 61.8% fib level is at 0.9278, expected to provide support.
USD/CHF renews its intraday low near 0.9305 as it pares the recent gains around the weekly top during Thursday’s sluggish session. The Swiss currency pair’s latest pullback could be linked to the market’s adjustments of the latest moves amid the Japan holidays and a pullback in the US Treasury bond yields.
The underlying reason could be linked to the comments from US President Joe Biden as he thinks that his Russian counterpart isn’t up to using nuclear arms by backing off an international treaty. However, the fears surrounding the Ukraine-Russia war are far from over, with the latest edition of the West and China escalating the matter to the worse. That said, the Wall Street Journal (WSJ) recently said that the US is considering the release of intelligence on China’s potential arms transfer to Russia. Previously, the China-Russia ties seemed to have escalated the geopolitical woes as the US strongly criticized such moves and favored the rush towards risk safety, which in turn favored the US Dollar.
Also likely to have favored the USD/CHF pullback is the latest retreat in the US inflation expectations. That said, the 10-year and 5-year breakeven inflation rates from the St. Louis Federal Reserve (FRED) signal a pullback in the US inflation expectations by retreating from the multi-day top.
Furthermore, the first daily negative of the US benchmark Treasury bond yields and mixed Wall Street close also allowed the US Dollar Index (DXY) to pare recent gains and weigh on the USD/CHF prices.
It’s worth noting that the latest Federal Open Market Committee’s (FOMC) Monetary Policy Meeting Minutes stated that all participants agreed more rate hikes are needed to achieve the inflation target while also favoring further Fed balance sheet reductions, which in turn favored DXY bulls. On the same line, St. Louis Federal Reserve President James Bullard also mentioned that the Fed will have to go north of 5% to tame inflation, as reported by Reuters. The policymaker also stated that he believes there are good chances they could beat inflation this year without creating a recession. Additionally, Federal Reserve Bank of New York President John Williams highlighted the concerns favoring the Fed’s higher rates by saying, per Reuters, “Fed is absolutely committed to getting inflation back to 2%.”
Looking ahead, second estimations of the US Personal Consumption Expenditures (PCE) details for the fourth quarter (Q4), as well as the preliminary readings of the US Q4 Gross Domestic Product (GDP), will be important for fresh directions to the USD/CHF traders.
Despite the latest retreat, USD/CHF remains well above the 50-day Exponential Moving Average (EMA) support surrounding 0.9285, which in turn suggests more chances of its further run-up towards the previous monthly high of 0.9410.
Technical Levels: Supports and Resistances
USDCHF currently trading at 0.9306 at the time of writing. Pair opened at 0.9315 and is trading with a change of -0.10% % .
| Overview | Overview.1 | |
|---|---|---|
| 0 | Today last price | 0.9306 |
| 1 | Today Daily Change | -0.0009 |
| 2 | Today Daily Change % | -0.10% |
| 3 | Today daily open | 0.9315 |
The pair is trading above its 20 Daily moving average @ 0.9223, above its 50 Daily moving average @ 0.9249 , below its 100 Daily moving average @ 0.9476 and below its 200 Daily moving average @ 0.9576
| Trends | Trends.1 | |
|---|---|---|
| 0 | Daily SMA20 | 0.9223 |
| 1 | Daily SMA50 | 0.9249 |
| 2 | Daily SMA100 | 0.9476 |
| 3 | Daily SMA200 | 0.9576 |
The previous day high was 0.9319 while the previous day low was 0.9253. The daily 38.2% Fib levels comes at 0.9294, expected to provide support. Similarly, the daily 61.8% fib level is at 0.9278, expected to provide support.
Note the levels of interest below:
- Pivot support is noted at 0.9273, 0.923, 0.9207
- Pivot resistance is noted at 0.9338, 0.9361, 0.9404
| Levels | Levels.1 |
|---|---|
| Previous Daily High | 0.9319 |
| Previous Daily Low | 0.9253 |
| Previous Weekly High | 0.9332 |
| Previous Weekly Low | 0.9138 |
| Previous Monthly High | 0.9410 |
| Previous Monthly Low | 0.9085 |
| Daily Fibonacci 38.2% | 0.9294 |
| Daily Fibonacci 61.8% | 0.9278 |
| Daily Pivot Point S1 | 0.9273 |
| Daily Pivot Point S2 | 0.9230 |
| Daily Pivot Point S3 | 0.9207 |
| Daily Pivot Point R1 | 0.9338 |
| Daily Pivot Point R2 | 0.9361 |
| Daily Pivot Point R3 | 0.9404 |
[/s2If]
Join Our Telegram Group
")


