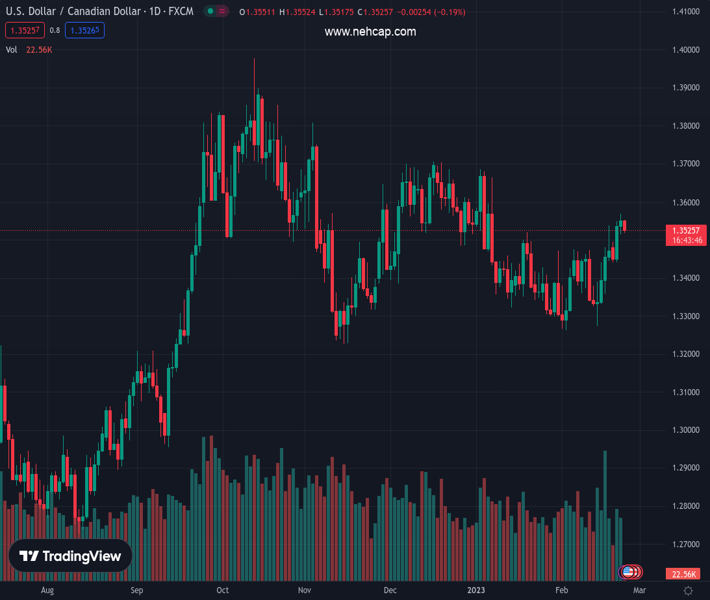
#USDCAD @ 1.35244 holds lower ground near intraday low, snaps two-day uptrend., @nehcap view: Limited downside expected (Pivot Orderbook analysis)
…
This is a premium post.
[s2If !current_user_can(access_s2member_level4)]Please register for PREMIUM VERSION HERE to read full post below containing analysis. In case of any error or you think you are not able to read the full post below, please email us at support#nehcap.com [lwa][/s2If] [s2If current_user_can(access_s2member_level4)]
- USD/CAD holds lower ground near intraday low, snaps two-day uptrend.
- Bearish MACD signals, downbeat RSI hints at further downside of the Loonie pair.
- Convergence of 100-HMA, support line of two-week-old ascending triangle restricts short-term declines of the USD/CAD pair.
The pair currently trades last at 1.35244.
The previous day high was 1.3568 while the previous day low was 1.3515. The daily 38.2% Fib levels comes at 1.3548, expected to provide resistance. Similarly, the daily 61.8% fib level is at 1.3535, expected to provide resistance.
USD/CAD drops 0.25% intraday during the first loss-making day in three heading into Thursday’s European session. In doing so, the Loonie pair drops to 1.3520 by the press time.
That said, the USD/CAD pair’s latest moves appear forming a fortnight-old ascending triangle formation. The same joins downbeat RSI (14) and bearish MACD signals to favor the bearish chart formation.
However, a clear downside break of 1.3500 becomes necessary as the 100-Hour Moving Average (HMA) joins the stated triangle’s lower line to increase the strength of the stated support confluence.
Following that, tops marked during late January and early February, respectively near 1.3520 and 1.3475, could probe the USD/CAD bears before directing them to the theoretical target surrounding 1.3200.
On the contrary, USD/CAD buyers may aim for the latest swing high surrounding 1.3570 before poking the stated triangle’s top line, close to 1.3585 by the press time.
In a case where the Loonie pair remains firmer past 1.3585, the bearish chart formation gets defied as the bulls brace for a late 2022 swing high surrounding 1.3700.
To sum up, USD/CAD slips off bull’s radar but the sellers await clear break of 1.3500 to retake control.
Trend: Limited downside expected
Technical Levels: Supports and Resistances
USDCAD currently trading at 1.3522 at the time of writing. Pair opened at 1.3556 and is trading with a change of -0.25% % .
| Overview | Overview.1 | |
|---|---|---|
| 0 | Today last price | 1.3522 |
| 1 | Today Daily Change | -0.0034 |
| 2 | Today Daily Change % | -0.25% |
| 3 | Today daily open | 1.3556 |
The pair remains strongly bullish on the daily timeframe. It trades above its 20 SMA @ 1.3399, 50 SMA 1.3466, 100 SMA @ 1.3515 and 200 SMA @ 1.3256.
| Trends | Trends.1 | |
|---|---|---|
| 0 | Daily SMA20 | 1.3399 |
| 1 | Daily SMA50 | 1.3466 |
| 2 | Daily SMA100 | 1.3515 |
| 3 | Daily SMA200 | 1.3256 |
The previous day high was 1.3568 while the previous day low was 1.3515. The daily 38.2% Fib levels comes at 1.3548, expected to provide resistance. Similarly, the daily 61.8% fib level is at 1.3535, expected to provide resistance.
Note the levels of interest below:
- Pivot support is noted at 1.3524, 1.3493, 1.3471
- Pivot resistance is noted at 1.3578, 1.36, 1.3632
| Levels | Levels.1 |
|---|---|
| Previous Daily High | 1.3568 |
| Previous Daily Low | 1.3515 |
| Previous Weekly High | 1.3538 |
| Previous Weekly Low | 1.3274 |
| Previous Monthly High | 1.3685 |
| Previous Monthly Low | 1.3300 |
| Daily Fibonacci 38.2% | 1.3548 |
| Daily Fibonacci 61.8% | 1.3535 |
| Daily Pivot Point S1 | 1.3524 |
| Daily Pivot Point S2 | 1.3493 |
| Daily Pivot Point S3 | 1.3471 |
| Daily Pivot Point R1 | 1.3578 |
| Daily Pivot Point R2 | 1.3600 |
| Daily Pivot Point R3 | 1.3632 |
[/s2If]
Join Our Telegram Group
")


