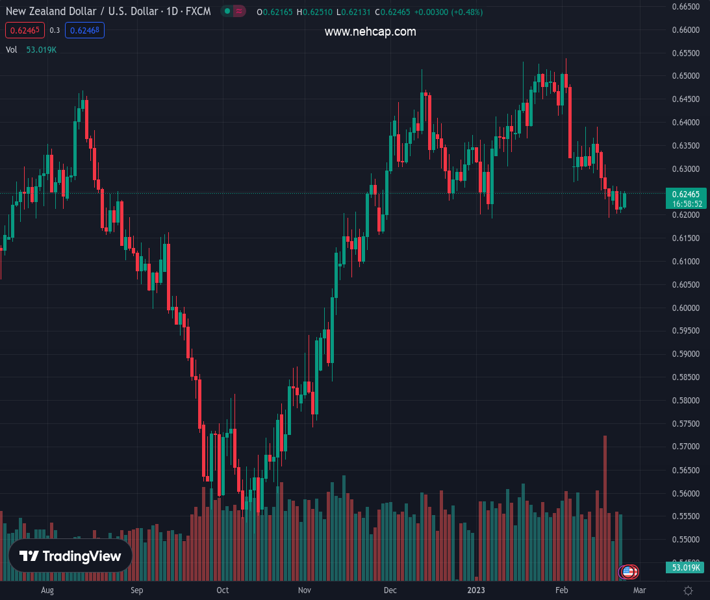
#NZDUSD @ 0.62485 has displayed a sheer recovery to near 0.6250 as the risk-on mood solidifies. (Pivot Orderbook analysis)
…
This is a premium post.
[s2If !current_user_can(access_s2member_level4)]Please register for PREMIUM VERSION HERE to read full post below containing analysis. In case of any error or you think you are not able to read the full post below, please email us at support#nehcap.com [lwa][/s2If] [s2If current_user_can(access_s2member_level4)]
- NZD/USD has displayed a sheer recovery to near 0.6250 as the risk-on mood solidifies.
- The Kiwi asset is attempting to deliver a breakout of the Symmetrical Triangle.
- The RSI (14) is on the verge of delivering a break into the bullish range of 60.00-80.00.
The pair currently trades last at 0.62485.
The previous day high was 0.6253 while the previous day low was 0.6205. The daily 38.2% Fib levels comes at 0.6235, expected to provide support. Similarly, the daily 61.8% fib level is at 0.6223, expected to provide support.
The NZD/USD pair has recovered dramatically after sensing a buying interest around 0.6210 in the Asian session. The Kiwi asset has extended its recovery to near 0.6250 after a responsive buying action and is looking to drive its range extension further as the risk-on impulse has solidified.
Investors have digested the fact that galloping inflation in the United States needs immediate treatment, therefore, the Federal Reserve (Fed) cannot pause the policy tightening spell as it could dampen the efforts yet made to bring it down. The US Dollar Index (DXY) is resisting in continuing the downside further after correcting to near 104.00. However, the positive market sentiment could continue sending pressure on the safe-haven assets.
NZD/USD is attempting to deliver a breakout of the Symmetrical Triangle chart pattern that indicates a sheer volatility contraction on an hourly scale. The downward-sloping trendline of the above-mentioned chart pattern is placed from February 20 high at 0.6262 while the upward-sloping trendline is placed from February 17 low at 0.6204.
The Kiwi asset has successfully shifted its auction above the 50-period Exponential Moving Average (EMA) at 0.6233, which indicates more upside ahead.
Meanwhile, the Relative Strength Index (RSI) (14) is on the verge of delivering a break into the bullish range of 60.00-80.00, which will trigger the upside momentum.
For further upside, the Kiwi asset needs to surpass January 8 low at 0.6272, which will drive the asset towards January 9 low at 0.6320, followed by February 7 high at 0.6363.
Alternatively, a breakdown of January 6 low at 0.6193 will drag the asset toward November 28 low at 0.6155. A slippage below the latter will expose the asset for more downside toward the round-level support at 0.6100.
Technical Levels: Supports and Resistances
NZDUSD currently trading at 0.625 at the time of writing. Pair opened at 0.6218 and is trading with a change of 0.51 % .
| Overview | Overview.1 | |
|---|---|---|
| 0 | Today last price | 0.6250 |
| 1 | Today Daily Change | 0.0032 |
| 2 | Today Daily Change % | 0.5100 |
| 3 | Today daily open | 0.6218 |
The pair is trading below its 20 Daily moving average @ 0.6347, below its 50 Daily moving average @ 0.6354 , above its 100 Daily moving average @ 0.6175 and above its 200 Daily moving average @ 0.6185
| Trends | Trends.1 | |
|---|---|---|
| 0 | Daily SMA20 | 0.6347 |
| 1 | Daily SMA50 | 0.6354 |
| 2 | Daily SMA100 | 0.6175 |
| 3 | Daily SMA200 | 0.6185 |
The previous day high was 0.6253 while the previous day low was 0.6205. The daily 38.2% Fib levels comes at 0.6235, expected to provide support. Similarly, the daily 61.8% fib level is at 0.6223, expected to provide support.
Note the levels of interest below:
- Pivot support is noted at 0.6198, 0.6177, 0.615
- Pivot resistance is noted at 0.6246, 0.6273, 0.6294
| Levels | Levels.1 |
|---|---|
| Previous Daily High | 0.6253 |
| Previous Daily Low | 0.6205 |
| Previous Weekly High | 0.6391 |
| Previous Weekly Low | 0.6193 |
| Previous Monthly High | 0.6531 |
| Previous Monthly Low | 0.6190 |
| Daily Fibonacci 38.2% | 0.6235 |
| Daily Fibonacci 61.8% | 0.6223 |
| Daily Pivot Point S1 | 0.6198 |
| Daily Pivot Point S2 | 0.6177 |
| Daily Pivot Point S3 | 0.6150 |
| Daily Pivot Point R1 | 0.6246 |
| Daily Pivot Point R2 | 0.6273 |
| Daily Pivot Point R3 | 0.6294 |
[/s2If]
Join Our Telegram Group
")


