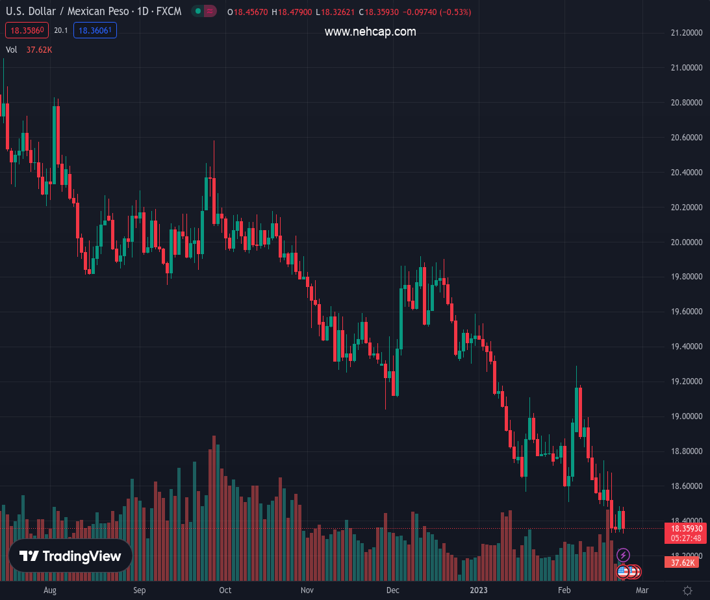
#USDMXN @ 18.3617 Mexican Peso outperforms among emerging market currencies. (Pivot Orderbook analysis)
…
This is a premium post.
[s2If !current_user_can(access_s2member_level4)]Please register for PREMIUM VERSION HERE to read full post below containing analysis. In case of any error or you think you are not able to read the full post below, please email us at support#nehcap.com [lwa][/s2If] [s2If current_user_can(access_s2member_level4)]
- Mexican Peso outperforms among emerging market currencies.
- USD/MXN holds near multi-year lows, despite risk aversion and higher US yields.
- Strong support emerges around 18.30 while critical resistance seen at 18.50.
The pair currently trades last at 18.3617.
The previous day high was 18.4827 while the previous day low was 18.3348. The daily 38.2% Fib levels comes at 18.4262, expected to provide resistance. Similarly, the daily 61.8% fib level is at 18.3913, expected to provide resistance.
The USD/MXN reversed after reaching a daily high near 18.50 and dropped to 18.35, matching the lowest level since 2018. The pair continues to move with a bearish bias despite risk aversion.
Market participants await the outcome of the minutes from the latest FOMC meeting. They will look for clues about the future of US monetary policy.
Ahead of the minutes, the US dollar holds firms in the market supported by higher US yields and risk aversion. The latest round of economic numbers showed an unexpected recovery in the service sector, favoring expectations of a hawkish Fed.
Despite higher US yields, a firmer dollar and a deterioration in market sentiment, the Mexican Peso continues to rise versus the greenback. Among emerging market currencies, the MXN is one of the best performers of the last week and also over the last 30 days.
The Mexican Peso is receiving support from Banxico which is seen raising rates again at the next meeting after a hawkish surprise at the latest board meeting.
Bias in USD/MXN continues to be tilted to the downside. The area around 18.30 is the key support. A break lower could open the doors for a slide toward 18.00. A recovery above 18.50 should alleviate the bearish pressure.
Technical Levels: Supports and Resistances
USDMXN currently trading at 18.37 at the time of writing. Pair opened at 18.4684 and is trading with a change of -0.53 % .
| Overview | Overview.1 | |
|---|---|---|
| 0 | Today last price | 18.3700 |
| 1 | Today Daily Change | -0.0984 |
| 2 | Today Daily Change % | -0.5300 |
| 3 | Today daily open | 18.4684 |
The pair remains strongly bearish on the daily time frame. It trades below the 20 SMA @ 18.7014, 50 SMA 19.0387, 100 SMA @ 19.358 and 200 SMA @ 19.7451.
| Trends | Trends.1 | |
|---|---|---|
| 0 | Daily SMA20 | 18.7014 |
| 1 | Daily SMA50 | 19.0387 |
| 2 | Daily SMA100 | 19.3580 |
| 3 | Daily SMA200 | 19.7451 |
The previous day high was 18.4827 while the previous day low was 18.3348. The daily 38.2% Fib levels comes at 18.4262, expected to provide resistance. Similarly, the daily 61.8% fib level is at 18.3913, expected to provide resistance.
Note the levels of interest below:
- Pivot support is noted at 18.3745, 18.2806, 18.2265
- Pivot resistance is noted at 18.5224, 18.5766, 18.6704
| Levels | Levels.1 |
|---|---|
| Previous Daily High | 18.4827 |
| Previous Daily Low | 18.3348 |
| Previous Weekly High | 18.7540 |
| Previous Weekly Low | 18.3306 |
| Previous Monthly High | 19.5361 |
| Previous Monthly Low | 18.5663 |
| Daily Fibonacci 38.2% | 18.4262 |
| Daily Fibonacci 61.8% | 18.3913 |
| Daily Pivot Point S1 | 18.3745 |
| Daily Pivot Point S2 | 18.2806 |
| Daily Pivot Point S3 | 18.2265 |
| Daily Pivot Point R1 | 18.5224 |
| Daily Pivot Point R2 | 18.5766 |
| Daily Pivot Point R3 | 18.6704 |
[/s2If]
Join Our Telegram Group
")


