#USDCHF @ 0.93087 is almost flat as Thursday’s Asian session kicks in. (Pivot Orderbook analysis)
…
This is a premium post.
[s2If !current_user_can(access_s2member_level4)]Please register for PREMIUM VERSION HERE to read full post below containing analysis. In case of any error or you think you are not able to read the full post below, please email us at support#nehcap.com [lwa][/s2If] [s2If current_user_can(access_s2member_level4)]
- USD/CHF is almost flat as Thursday’s Asian session kicks in.
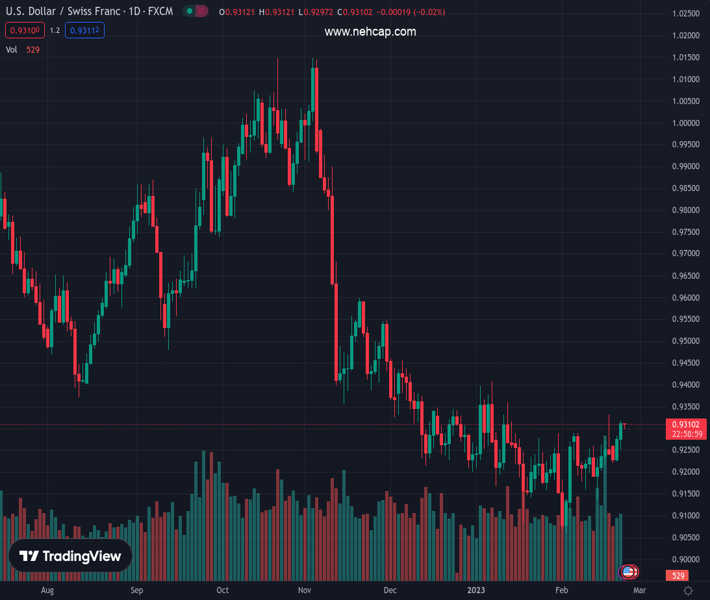
- USD/CHF Price Analysis: Downward biased, though it appears to have bottomed around 0.9000.
The pair currently trades last at 0.93087.
The previous day high was 0.9283 while the previous day low was 0.9228. The daily 38.2% Fib levels comes at 0.9262, expected to provide support. Similarly, the daily 61.8% fib level is at 0.9249, expected to provide support.
The USD/CHF clings to 0.9300 as the Asian Pacific session begins, but it’s trading beneath its opening price after printing a new weekly high of 0.9318 and gaining 0.39% on Wednesday. At the time of typing, the USD/CHF exchanges hands at 0.9302.
The USD/CHF pair is neutral to downward biased, with the long-term Exponential Moving Averages (EMAs), the 100 and 200-day EMAs, sitting above the exchange rate each at 0.9383 and 0.9454, respectively. In addition, the USD/CHF spot price remains below the January 6 daily high of 0.9409, which, once broken, could send the pair rallying to test the 200-day EMA.
Even though the USD/CHF bias is tilted to the downside, the pair appears to have bottomed around 0.9059. Also, the Relative Strength Index (RSI) and the Rate of Change (RoC) are bullish, suggesting buyers are piling in.
Therefore, the USD/CHF path of least resistance is upward in the near term. The first resistance would be the last week’s high at 0.9331. A decisive break and the following resistance tested would be the 100-day EMA at 0.9383, ahead of the 0.9400 figure. Once those two supply zones are conquered, buyers will aim toward the 200-day EMA at 0.9454 before posing a threat of the 0.9500 figure.
Contrarily, if the USD/CHF drops below the 50-day EMA at 0.9281, that would exacerbate a fall toward the February 14 daily low at 0.9135.
Technical Levels: Supports and Resistances
USDCHF currently trading at 0.9308 at the time of writing. Pair opened at 0.9276 and is trading with a change of 0.34 % .
| Overview | Overview.1 | |
|---|---|---|
| 0 | Today last price | 0.9308 |
| 1 | Today Daily Change | 0.0032 |
| 2 | Today Daily Change % | 0.3400 |
| 3 | Today daily open | 0.9276 |
The pair is trading above its 20 Daily moving average @ 0.9216, above its 50 Daily moving average @ 0.9247 , below its 100 Daily moving average @ 0.9481 and below its 200 Daily moving average @ 0.9579
| Trends | Trends.1 | |
|---|---|---|
| 0 | Daily SMA20 | 0.9216 |
| 1 | Daily SMA50 | 0.9247 |
| 2 | Daily SMA100 | 0.9481 |
| 3 | Daily SMA200 | 0.9579 |
The previous day high was 0.9283 while the previous day low was 0.9228. The daily 38.2% Fib levels comes at 0.9262, expected to provide support. Similarly, the daily 61.8% fib level is at 0.9249, expected to provide support.
Note the levels of interest below:
- Pivot support is noted at 0.9242, 0.9208, 0.9188
- Pivot resistance is noted at 0.9297, 0.9317, 0.9352
| Levels | Levels.1 |
|---|---|
| Previous Daily High | 0.9283 |
| Previous Daily Low | 0.9228 |
| Previous Weekly High | 0.9332 |
| Previous Weekly Low | 0.9138 |
| Previous Monthly High | 0.9410 |
| Previous Monthly Low | 0.9085 |
| Daily Fibonacci 38.2% | 0.9262 |
| Daily Fibonacci 61.8% | 0.9249 |
| Daily Pivot Point S1 | 0.9242 |
| Daily Pivot Point S2 | 0.9208 |
| Daily Pivot Point S3 | 0.9188 |
| Daily Pivot Point R1 | 0.9297 |
| Daily Pivot Point R2 | 0.9317 |
| Daily Pivot Point R3 | 0.9352 |
[/s2If]
Join Our Telegram Group
")


