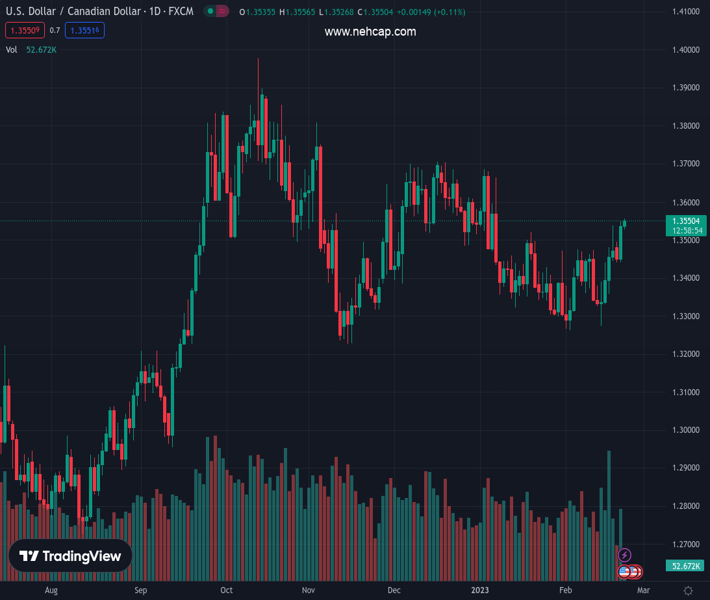
#USDCAD @ 1.35523 gains traction for the second straight day and climbs to its highest level since January. (Pivot Orderbook analysis)
…
This is a premium post.
[s2If !current_user_can(access_s2member_level4)]Please register for PREMIUM VERSION HERE to read full post below containing analysis. In case of any error or you think you are not able to read the full post below, please email us at support#nehcap.com [lwa][/s2If] [s2If current_user_can(access_s2member_level4)]
- USD/CAD gains traction for the second straight day and climbs to its highest level since January.
- Tuesday’s softer Canadian CPI, bearish oil prices undermine the Loonie and remain supportive.
- Hawkish Fed expectations favour the USD bulls ahead of the crucial FOMC meeting minutes.
The pair currently trades last at 1.35523.
The previous day high was 1.3549 while the previous day low was 1.3441. The daily 38.2% Fib levels comes at 1.3508, expected to provide support. Similarly, the daily 61.8% fib level is at 1.3483, expected to provide support.
The USD/CAD pair attracts some buying for the second straight day on Wednesday and touched its highest level since January 6 during the first half of the European session. The pair currently trades around the 1.3550 region and seems poised to prolong its recent upward trajectory witnessed over the past week or so.
A combination of factors undermines the Canadian Dollar, which, in turn, assists the USD/CAD pair to capitalize on the previous day’s strong move up and gain traction for the second straight day. The softer Canadian consumer inflation figures released on Tuesday fueled speculations that the Bank of Canada could pause the rate-hiking cycle. Adding to this, bearish Crude Oil prices – amid worries that rapidly rising borrowing costs will dampen economic growth and dent fuel demand – further weighs on the commodity-linked Loonie.
The US Dollar, on the other hand, continues to draw support from firming expectations that the Federal Reserve will stick to its hawkish stance. In fact, the markets are pricing in at least a 25 bps lift-off at the next two FOMC policy meetings in March and May. The bets were reaffirmed by strong US PMIs on Tuesday, which showed that business activity unexpectedly rebounded to an eight-month high in February. The data pointed to an economy that remains resilient and support prospects for further policy tightening by the Fed.
Moreover, several FOMC officials, including Chairman Jerome Powell, recently stressed the need to keep raising rates gradually to fully gain control of inflation. Hence, the focus will remain glued to the release of the FOMC monetary policy meeting minutes, due later during the US session. Investors will look for fresh cues about the Fed’s rate-hike path, which will influence the USD and provide a fresh impetus to the USD/CAD pair. Apart from this, oil price dynamics could further contribute to producing meaningful trading opportunities.
Technical Levels: Supports and Resistances
USDCAD currently trading at 1.3555 at the time of writing. Pair opened at 1.3537 and is trading with a change of 0.13 % .
| Overview | Overview.1 | |
|---|---|---|
| 0 | Today last price | 1.3555 |
| 1 | Today Daily Change | 0.0018 |
| 2 | Today Daily Change % | 0.1300 |
| 3 | Today daily open | 1.3537 |
The pair remains strongly bullish on the daily timeframe. It trades above its 20 SMA @ 1.339, 50 SMA 1.3466, 100 SMA @ 1.3516 and 200 SMA @ 1.3253.
| Trends | Trends.1 | |
|---|---|---|
| 0 | Daily SMA20 | 1.3390 |
| 1 | Daily SMA50 | 1.3466 |
| 2 | Daily SMA100 | 1.3516 |
| 3 | Daily SMA200 | 1.3253 |
The previous day high was 1.3549 while the previous day low was 1.3441. The daily 38.2% Fib levels comes at 1.3508, expected to provide support. Similarly, the daily 61.8% fib level is at 1.3483, expected to provide support.
Note the levels of interest below:
- Pivot support is noted at 1.3469, 1.3401, 1.3361
- Pivot resistance is noted at 1.3577, 1.3617, 1.3685
| Levels | Levels.1 |
|---|---|
| Previous Daily High | 1.3549 |
| Previous Daily Low | 1.3441 |
| Previous Weekly High | 1.3538 |
| Previous Weekly Low | 1.3274 |
| Previous Monthly High | 1.3685 |
| Previous Monthly Low | 1.3300 |
| Daily Fibonacci 38.2% | 1.3508 |
| Daily Fibonacci 61.8% | 1.3483 |
| Daily Pivot Point S1 | 1.3469 |
| Daily Pivot Point S2 | 1.3401 |
| Daily Pivot Point S3 | 1.3361 |
| Daily Pivot Point R1 | 1.3577 |
| Daily Pivot Point R2 | 1.3617 |
| Daily Pivot Point R3 | 1.3685 |
[/s2If]
Join Our Telegram Group
")


