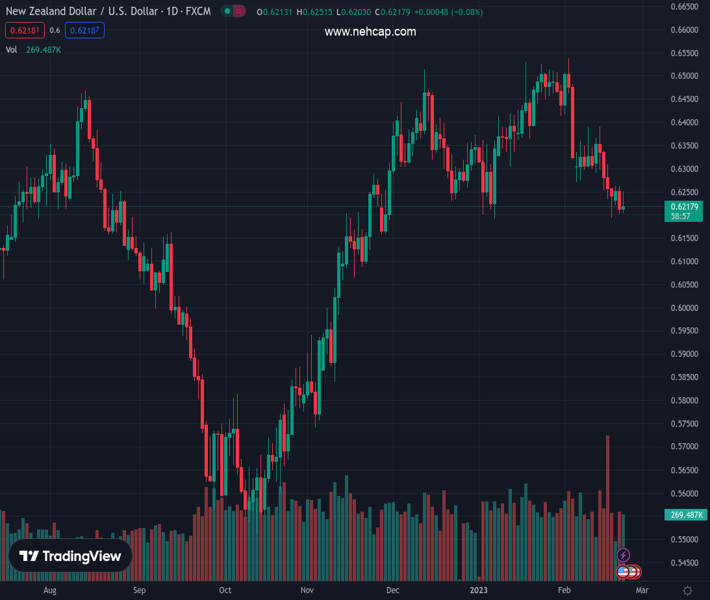
#NZDUSD @ 0.62172 bears are in town on a stronger US Dollar. (Pivot Orderbook analysis)
…
This is a premium post.
[s2If !current_user_can(access_s2member_level4)]Please register for PREMIUM VERSION HERE to read full post below containing analysis. In case of any error or you think you are not able to read the full post below, please email us at support#nehcap.com [lwa][/s2If] [s2If current_user_can(access_s2member_level4)]
- NZD/USD bears are in town on a stronger US Dollar.
- RBNZ struck a hawkish tone but US data dominates.
The pair currently trades last at 0.62172.
The previous day high was 0.6262 while the previous day low was 0.6203. The daily 38.2% Fib levels comes at 0.6225, expected to provide resistance. Similarly, the daily 61.8% fib level is at 0.6239, expected to provide resistance.
NZD/USD is bid by some 0.11% but pressured overall following the release of a hawkish set of Federal Open Market Committee minutes whereby a few participants had favoured raising rates by 50 basis points which has put a bid in the US Dollar but left the US Treasury Yield relatively stable.
”Markets have been forced to reprice interest rate expectations, not just higher, but also questioning the view that once peak rates are hit, central banks will pivot quickly to cutting interest rates,” analysts at ANZ Bank said in a note on Thursday morning in Asia.
”The early 2023 indications are that economic activity is more resilient than data implied in Q4 and that monetary tightening is not yet bearing down on broader economic activity. Economic resilience is to be lauded, but central banks are uncomfortable with current levels of aggregate expenditure and labour market demand.”
”They need to stay hawkish and are not yet in a position to declare that interest rates are “sufficiently restrictive”. If the upcoming run of February data for the US confirm robust economic activity, it is difficult to see how risk will recover in the near term.”
Speaking of which, this week will provide The Fed’s favoured inflation measure, the PCE deflator. ”The market is expecting the January headline data to remain at 5.0% YoY, in line with the previous month,” analysts at Rabobank said. ”This would strengthen concerns that the downtrend in inflationary indicators may have stalled.
Data in line with market expectations would thus add further weight to the view that the Fed will have to work harder to push inflation back to its target level. Currently implied market rates are pointing to a peak in Fed funds close to 5.33%.”
Domestically, the overall tone of the Reserve Bank of New Zealand’s statement yesterday remained hawkish, and of note, they landed firmly on the side of economics rather than emotions, the analysts at ANZ Bank explained today.
”They also highlighted the longer-term inflationary risks surrounding cyclone recovery, which speak to stronger activity and a higher OCR. There isn’t enough information available just yet, but in time, that could play into NZD strength in upcoming meetings.”
Technical Levels: Supports and Resistances
NZDUSD currently trading at 0.6218 at the time of writing. Pair opened at 0.6209 and is trading with a change of 0.14 % .
| Overview | Overview.1 | |
|---|---|---|
| 0 | Today last price | 0.6218 |
| 1 | Today Daily Change | 0.0009 |
| 2 | Today Daily Change % | 0.1400 |
| 3 | Today daily open | 0.6209 |
The pair is trading below its 20 Daily moving average @ 0.6361, below its 50 Daily moving average @ 0.6359 , above its 100 Daily moving average @ 0.617 and above its 200 Daily moving average @ 0.6186
| Trends | Trends.1 | |
|---|---|---|
| 0 | Daily SMA20 | 0.6361 |
| 1 | Daily SMA50 | 0.6359 |
| 2 | Daily SMA100 | 0.6170 |
| 3 | Daily SMA200 | 0.6186 |
The previous day high was 0.6262 while the previous day low was 0.6203. The daily 38.2% Fib levels comes at 0.6225, expected to provide resistance. Similarly, the daily 61.8% fib level is at 0.6239, expected to provide resistance.
Note the levels of interest below:
- Pivot support is noted at 0.6187, 0.6165, 0.6128
- Pivot resistance is noted at 0.6247, 0.6284, 0.6306
| Levels | Levels.1 |
|---|---|
| Previous Daily High | 0.6262 |
| Previous Daily Low | 0.6203 |
| Previous Weekly High | 0.6391 |
| Previous Weekly Low | 0.6193 |
| Previous Monthly High | 0.6531 |
| Previous Monthly Low | 0.6190 |
| Daily Fibonacci 38.2% | 0.6225 |
| Daily Fibonacci 61.8% | 0.6239 |
| Daily Pivot Point S1 | 0.6187 |
| Daily Pivot Point S2 | 0.6165 |
| Daily Pivot Point S3 | 0.6128 |
| Daily Pivot Point R1 | 0.6247 |
| Daily Pivot Point R2 | 0.6284 |
| Daily Pivot Point R3 | 0.6306 |
[/s2If]
Join Our Telegram Group
")


