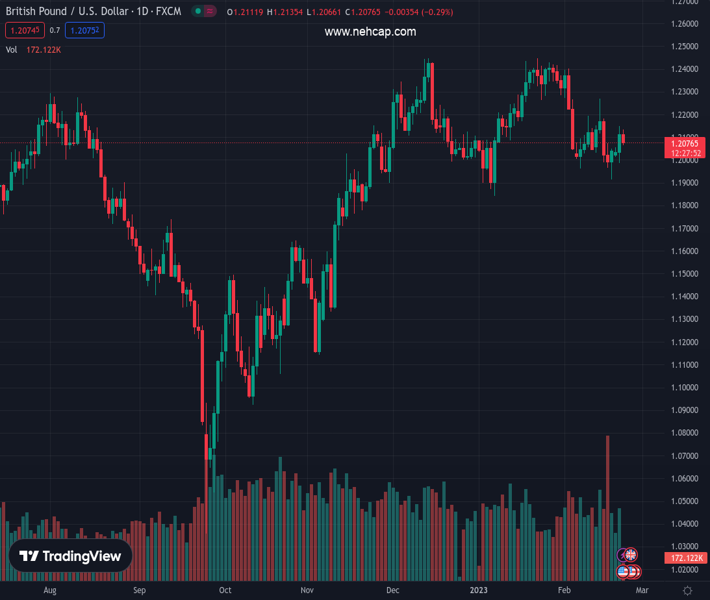
#GBPUSD @ 1.20748 comes under some selling pressure on Tuesday and snaps a three-day winning streak. (Pivot Orderbook analysis)
…
This is a premium post.
[s2If !current_user_can(access_s2member_level4)]Please register for PREMIUM VERSION HERE to read full post below containing analysis. In case of any error or you think you are not able to read the full post below, please email us at support#nehcap.com [lwa][/s2If] [s2If current_user_can(access_s2member_level4)]
- GBP/USD comes under some selling pressure on Tuesday and snaps a three-day winning streak.
- Hawkish Fed expectations, looming recession risks underpin the USD and weigh on the major.
- Bets for additional rate hikes by the BoE could help limit losses ahead of the FOMC minutes.
The pair currently trades last at 1.20748.
The previous day high was 1.2148 while the previous day low was 1.1986. The daily 38.2% Fib levels comes at 1.2086, expected to provide resistance. Similarly, the daily 61.8% fib level is at 1.2048, expected to provide support.
The GBP/USD pair comes under some selling pressure following an early uptick to the 1.2135 region and drops to a fresh daily low during the first half of the European session. Spot prices currently trade around the 1.2080-1.2075 region, down nearly 0.30% for the day, and for now, seem to have snapped a three-day winning streak.
The US Dollar (USD) remains pinned near a six-week top amid expectations for further policy tightening by the Federal Reserve (Fed) and turns out to be a key factor weighing on the GBP/USD pair. In fact, the markets are now pricing in at least a 25 bps lift-off at each of the next two FOMC policy meetings in March and May. The bets were lifted by strong US PMI prints on Tuesday, which showed that business activity unexpectedly rebounded to an eight-month high in February.
This comes on the back of the incoming positive US macro data, which pointed to an economy that remains resilient despite rising borrowing costs. Moreover, several FOMC officials, including Fed Chair Jerome Powell, recently stressed the need to keep raising rates gradually to fully gain control of inflation. This remains supportive of elevated US Treasury bond yields, which, along with looming recession risks and geopolitical tensions, continue to underpin the safe-haven buck.
Hence, the market focus will remain glued to the release of the minutes from the latest FOMC monetary policy meeting. Investors will look for fresh clues about the Fed’s rate-hike path, which will play a key role in influencing the near-term USD price dynamics and provide a fresh directional impetus to the GBP/USD pair. In the meantime, rising bets for additional interest rate hikes by the Bank of England (BoE) should lend support to the British Pound and help limit losses.
The UK PMIs released on Tuesday indicated that business activity rose more than expected in February and fueled optimism that the country may be able to avoid a steep economic downturn. This makes it prudent to wait for strong follow-through selling before confirming that the GBP/USD pair’s recent recovery move from a technically significant 200-day SMA has run out of steam.
Technical Levels: Supports and Resistances
GBPUSD currently trading at 1.2078 at the time of writing. Pair opened at 1.2106 and is trading with a change of -0.23 % .
| Overview | Overview.1 | |
|---|---|---|
| 0 | Today last price | 1.2078 |
| 1 | Today Daily Change | -0.0028 |
| 2 | Today Daily Change % | -0.2300 |
| 3 | Today daily open | 1.2106 |
The pair is trading below its 20 Daily moving average @ 1.2169, below its 50 Daily moving average @ 1.2164 , above its 100 Daily moving average @ 1.1916 and above its 200 Daily moving average @ 1.1937
| Trends | Trends.1 | |
|---|---|---|
| 0 | Daily SMA20 | 1.2169 |
| 1 | Daily SMA50 | 1.2164 |
| 2 | Daily SMA100 | 1.1916 |
| 3 | Daily SMA200 | 1.1937 |
The previous day high was 1.2148 while the previous day low was 1.1986. The daily 38.2% Fib levels comes at 1.2086, expected to provide resistance. Similarly, the daily 61.8% fib level is at 1.2048, expected to provide support.
Note the levels of interest below:
- Pivot support is noted at 1.2012, 1.1918, 1.185
- Pivot resistance is noted at 1.2174, 1.2242, 1.2336
| Levels | Levels.1 |
|---|---|
| Previous Daily High | 1.2148 |
| Previous Daily Low | 1.1986 |
| Previous Weekly High | 1.2270 |
| Previous Weekly Low | 1.1915 |
| Previous Monthly High | 1.2448 |
| Previous Monthly Low | 1.1841 |
| Daily Fibonacci 38.2% | 1.2086 |
| Daily Fibonacci 61.8% | 1.2048 |
| Daily Pivot Point S1 | 1.2012 |
| Daily Pivot Point S2 | 1.1918 |
| Daily Pivot Point S3 | 1.1850 |
| Daily Pivot Point R1 | 1.2174 |
| Daily Pivot Point R2 | 1.2242 |
| Daily Pivot Point R3 | 1.2336 |
[/s2If]
Join Our Telegram Group
")


