#GBPUSD @ 1.20488 is gauging an intermediate cushion around 1.2040, however, the overall market mood is still negative. (Pivot Orderbook analysis)
…
This is a premium post.
[s2If !current_user_can(access_s2member_level4)]Please register for PREMIUM VERSION HERE to read full post below containing analysis. In case of any error or you think you are not able to read the full post below, please email us at support#nehcap.com [lwa][/s2If] [s2If current_user_can(access_s2member_level4)]
- GBP/USD is gauging an intermediate cushion around 1.2040, however, the overall market mood is still negative.
- Fed policymakers are still reiterating higher interest rates for a longer period to achieve the 2% inflation target.
- The annualized US GDP Q4 data is seen stable at 2.9%.
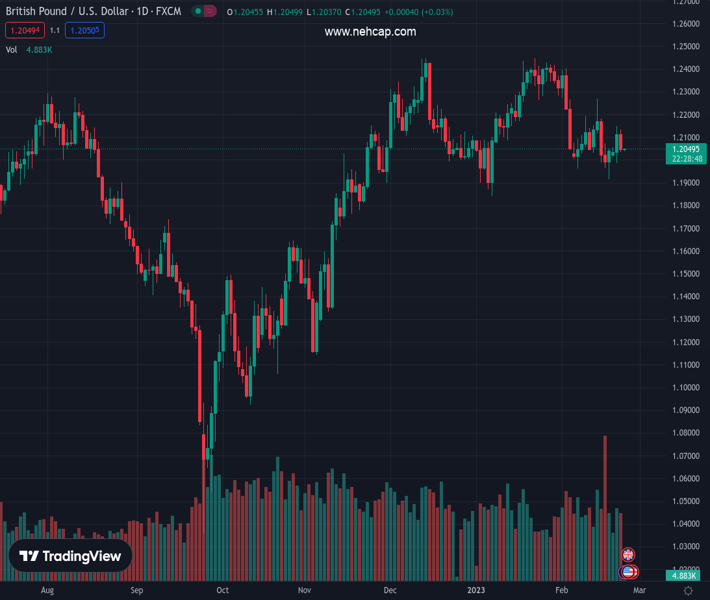
The pair currently trades last at 1.20488.
The previous day high was 1.2148 while the previous day low was 1.1986. The daily 38.2% Fib levels comes at 1.2086, expected to provide resistance. Similarly, the daily 61.8% fib level is at 1.2048, expected to provide support.
The GBP/USD pair has sensed a pause in the downside momentum after dropping to near 1.2040 in the early Asian session. It would be early to consider a loss in the downside momentum for the Cable as higher volatility might stay ahead of the release of the preliminary United States Gross Domestic Product (GDP) data for the fourth quarter of CY2022. The annualized economic data is seen stable at 2.9%
The Cable witnessed an intense sell-off in the late New York session after the release of the hawkish Federal Open Market Committee (FOMC) minutes. Federal Reserve (Fed) chair Jerome Powell and his mates are still reiterating higher interest rates for a longer period to drag the Consumer Price Index (CPI) to near 2% target.
Fed policymakers are worried that China’s reopening after the rollback of lockdown curbs and ongoing Russia’s invasion of Ukraine advocate upside risks in inflation. Domestically, a shortage of labor could propel a higher wage price index ahead.
Meanwhile, S&P500 futures have shown a recovery in the Asian session. The 500-US stocks basket futures have recovered their entire losses shown on Wednesday. A sense of optimism has been observed in the overall risk aversion theme.
The optimism could fade as President Joe Biden told that it was a “big mistake” for Russian President Vladimir Putin to temporarily suspend Russia’s participation in the last remaining nuclear arms treaty between the two countries. Earlier, US Biden announced “Russia was suspending its participation in the New START treaty, which implements caps on the number of nuclear weapons deployed by each country and inspections of nuclear sites,” as reported by ABC News.
The Pound Sterling looks struggling again as the recovery in manufacturing activities is not sufficient enough to avoid the recession ahead. The preliminary United Kingdom manufacturing activities remained upbeat at 49.2, however, a figure below 50.0 is considered a contraction. UK households are struggling to address their usual demand due to higher food inflation, which is impacting their confidence in the economic prospects.
Technical Levels: Supports and Resistances
GBPUSD currently trading at 1.2049 at the time of writing. Pair opened at 1.2106 and is trading with a change of -0.47 % .
| Overview | Overview.1 | |
|---|---|---|
| 0 | Today last price | 1.2049 |
| 1 | Today Daily Change | -0.0057 |
| 2 | Today Daily Change % | -0.4700 |
| 3 | Today daily open | 1.2106 |
The pair is trading below its 20 Daily moving average @ 1.2169, below its 50 Daily moving average @ 1.2164 , above its 100 Daily moving average @ 1.1916 and above its 200 Daily moving average @ 1.1937
| Trends | Trends.1 | |
|---|---|---|
| 0 | Daily SMA20 | 1.2169 |
| 1 | Daily SMA50 | 1.2164 |
| 2 | Daily SMA100 | 1.1916 |
| 3 | Daily SMA200 | 1.1937 |
The previous day high was 1.2148 while the previous day low was 1.1986. The daily 38.2% Fib levels comes at 1.2086, expected to provide resistance. Similarly, the daily 61.8% fib level is at 1.2048, expected to provide support.
Note the levels of interest below:
- Pivot support is noted at 1.2012, 1.1918, 1.185
- Pivot resistance is noted at 1.2174, 1.2242, 1.2336
| Levels | Levels.1 |
|---|---|
| Previous Daily High | 1.2148 |
| Previous Daily Low | 1.1986 |
| Previous Weekly High | 1.2270 |
| Previous Weekly Low | 1.1915 |
| Previous Monthly High | 1.2448 |
| Previous Monthly Low | 1.1841 |
| Daily Fibonacci 38.2% | 1.2086 |
| Daily Fibonacci 61.8% | 1.2048 |
| Daily Pivot Point S1 | 1.2012 |
| Daily Pivot Point S2 | 1.1918 |
| Daily Pivot Point S3 | 1.1850 |
| Daily Pivot Point R1 | 1.2174 |
| Daily Pivot Point R2 | 1.2242 |
| Daily Pivot Point R3 | 1.2336 |
[/s2If]
Join Our Telegram Group
")


