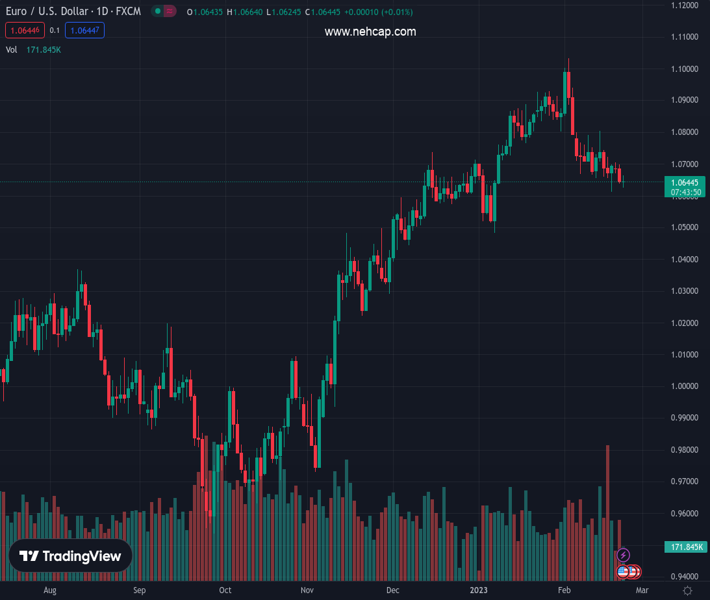
#EURUSD @ 1.06433 looks under pressure near the monthly lows. (Pivot Orderbook analysis)
…
This is a premium post.
[s2If !current_user_can(access_s2member_level4)]Please register for PREMIUM VERSION HERE to read full post below containing analysis. In case of any error or you think you are not able to read the full post below, please email us at support#nehcap.com [lwa][/s2If] [s2If current_user_can(access_s2member_level4)]
- EUR/USD looks under pressure near the monthly lows.
- The resistance line around 1.0915 keeps capping the upside.
The pair currently trades last at 1.06433.
The previous day high was 1.0698 while the previous day low was 1.0638. The daily 38.2% Fib levels comes at 1.0661, expected to provide resistance. Similarly, the daily 61.8% fib level is at 1.0675, expected to provide resistance.
EUR/USD extends the side-lined trade and remains close to the February lows.
If sellers regain the upper hand, pair could slip back to the February low at 1.0612 (February 17) in the near term. The breach of this level could see a potential test of the 2023 low at 1.0481 (January 6) emerge on the horizon.
So far, extra losses remain on the cards as long as the 3-month resistance line, today near 1.0915, caps the upside.
In the longer run, the constructive view remains unchanged while above the 200-day SMA, today at 1.0329.
Technical Levels: Supports and Resistances
EURUSD currently trading at 1.0646 at the time of writing. Pair opened at 1.0646 and is trading with a change of 0.0 % .
| Overview | Overview.1 | |
|---|---|---|
| 0 | Today last price | 1.0646 |
| 1 | Today Daily Change | 40.0000 |
| 2 | Today Daily Change % | 0.0000 |
| 3 | Today daily open | 1.0646 |
The pair is trading below its 20 Daily moving average @ 1.0776, below its 50 Daily moving average @ 1.0729 , above its 100 Daily moving average @ 1.0427 and above its 200 Daily moving average @ 1.0331
| Trends | Trends.1 | |
|---|---|---|
| 0 | Daily SMA20 | 1.0776 |
| 1 | Daily SMA50 | 1.0729 |
| 2 | Daily SMA100 | 1.0427 |
| 3 | Daily SMA200 | 1.0331 |
The previous day high was 1.0698 while the previous day low was 1.0638. The daily 38.2% Fib levels comes at 1.0661, expected to provide resistance. Similarly, the daily 61.8% fib level is at 1.0675, expected to provide resistance.
Note the levels of interest below:
- Pivot support is noted at 1.0623, 1.06, 1.0562
- Pivot resistance is noted at 1.0683, 1.0721, 1.0744
| Levels | Levels.1 |
|---|---|
| Previous Daily High | 1.0698 |
| Previous Daily Low | 1.0638 |
| Previous Weekly High | 1.0805 |
| Previous Weekly Low | 1.0613 |
| Previous Monthly High | 1.0930 |
| Previous Monthly Low | 1.0483 |
| Daily Fibonacci 38.2% | 1.0661 |
| Daily Fibonacci 61.8% | 1.0675 |
| Daily Pivot Point S1 | 1.0623 |
| Daily Pivot Point S2 | 1.0600 |
| Daily Pivot Point S3 | 1.0562 |
| Daily Pivot Point R1 | 1.0683 |
| Daily Pivot Point R2 | 1.0721 |
| Daily Pivot Point R3 | 1.0744 |
[/s2If]
Join Our Telegram Group
")


