#AUDUSD @ 0.70548 remains under some selling pressure for the second successive day on Friday. (Pivot Orderbook analysis)
…
This is a premium post.
[s2If !current_user_can(access_s2member_level4)]Please register for PREMIUM VERSION HERE to read full post below containing analysis. In case of any error or you think you are not able to read the full post below, please email us at support#nehcap.com [lwa][/s2If] [s2If current_user_can(access_s2member_level4)]
- AUD/USD remains under some selling pressure for the second successive day on Friday.
- The risk-off impulse weighs on the Aussie, though fresh USD selling helps limit losses.
- Investors now look forward to the key US monthly jobs data (NFP) for a fresh impetus.
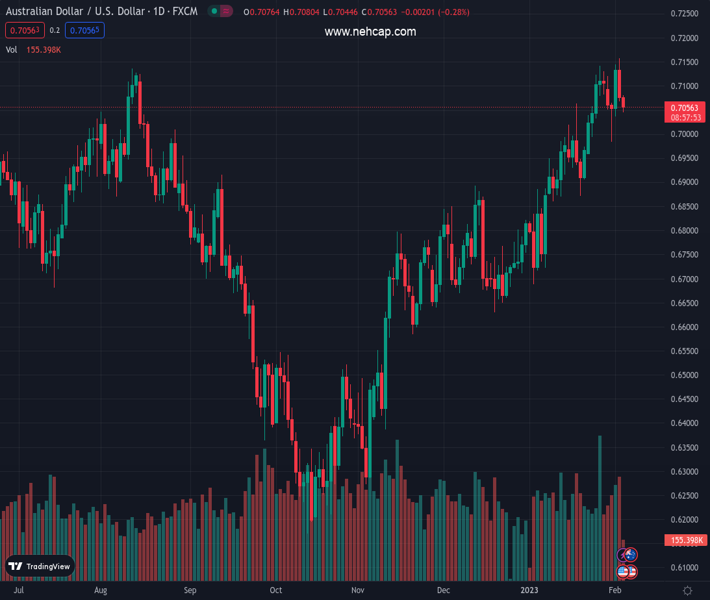
The pair currently trades last at 0.70548.
The previous day high was 0.7158 while the previous day low was 0.7069. The daily 38.2% Fib levels comes at 0.7103, expected to provide resistance. Similarly, the daily 61.8% fib level is at 0.7124, expected to provide resistance.
The AUD/USD pair is seen extending the previous day’s retracement slide from the 0.7155-0.7160 area, or its highest level since June 2022 and losing ground for the second successive day on Friday. The pair remains depressed heading into the North American session and is currently placed near the lower end o its daily range, around mid-0.7000s.
A generally weaker tone around the equity markets turns out to be a key factor weighing on the risk-sensitive Aussie, though the emergence of fresh US Dollar selling limits losses for the AUD/USD pair. Investors remain sceptical about a speedy Chinese economic recovery in the wake of rising COVID-19 cases and lingering supply chain issues. This, along with disappointing quarterly earnings reports from major tech sector players, disrupts the recent positive sentiment around perceived riskier assets.
The USD, on the other hand, fails to capitalize on the overnight bounce from a nine-month low amid a downtick in the US Treasury bond yields. That said, hopes for a positive surprise from the US Nonfarm Payrolls (NFP) might continue to act as a tailwind for the safe-haven Greenback. An unexpected fall in the US Initial Jobless Claims on Thursday pointed to the underlying strength in the labor market and forced investors to scale back their bets for an imminent pause of the Fed’s rate-hiking cycle.
Hence, the market focus will remain glued to the release of the closely-watched US monthly jobs data. Market participants seem concerned that robust employment could keep the US inflation higher and allow the Fed to stick to its hawkish stance for longer. This, in turn, could push the US bond yields higher, along with the USD, and set the way for some meaningful corrective decline for the AUD/USD pair. Nevertheless, spot prices, for now, seem to register the first weekly loss in seven.
Technical Levels: Supports and Resistances
AUDUSD currently trading at 0.7058 at the time of writing. Pair opened at 0.7084 and is trading with a change of -0.37 % .
| Overview | Overview.1 | |
|---|---|---|
| 0 | Today last price | 0.7058 |
| 1 | Today Daily Change | -0.0026 |
| 2 | Today Daily Change % | -0.3700 |
| 3 | Today daily open | 0.7084 |
The pair remains strongly bullish on the daily timeframe. It trades above its 20 SMA @ 0.7001, 50 SMA 0.6848, 100 SMA @ 0.6668 and 200 SMA @ 0.6811.
| Trends | Trends.1 | |
|---|---|---|
| 0 | Daily SMA20 | 0.7001 |
| 1 | Daily SMA50 | 0.6848 |
| 2 | Daily SMA100 | 0.6668 |
| 3 | Daily SMA200 | 0.6811 |
The previous day high was 0.7158 while the previous day low was 0.7069. The daily 38.2% Fib levels comes at 0.7103, expected to provide resistance. Similarly, the daily 61.8% fib level is at 0.7124, expected to provide resistance.
Note the levels of interest below:
- Pivot support is noted at 0.7049, 0.7014, 0.696
- Pivot resistance is noted at 0.7138, 0.7192, 0.7227
| Levels | Levels.1 |
|---|---|
| Previous Daily High | 0.7158 |
| Previous Daily Low | 0.7069 |
| Previous Weekly High | 0.7143 |
| Previous Weekly Low | 0.6960 |
| Previous Monthly High | 0.7143 |
| Previous Monthly Low | 0.6688 |
| Daily Fibonacci 38.2% | 0.7103 |
| Daily Fibonacci 61.8% | 0.7124 |
| Daily Pivot Point S1 | 0.7049 |
| Daily Pivot Point S2 | 0.7014 |
| Daily Pivot Point S3 | 0.6960 |
| Daily Pivot Point R1 | 0.7138 |
| Daily Pivot Point R2 | 0.7192 |
| Daily Pivot Point R3 | 0.7227 |
[/s2If]
Join Our Telegram Group
")


