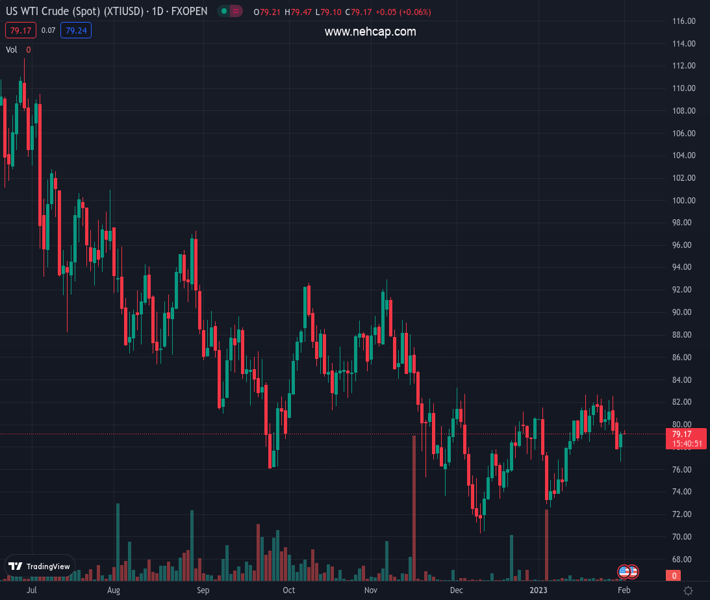
WTI crude oil fades bounce off three-week low even if it stays unchanged on a day. (Pivot Orderbook analysis)
…
This is a premium post.
[s2If !current_user_can(access_s2member_level4)]Please register for PREMIUM VERSION HERE to read full post below containing analysis. In case of any error or you think you are not able to read the full post below, please email us at support#nehcap.com [lwa][/s2If] [s2If current_user_can(access_s2member_level4)]
- WTI crude oil fades bounce off three-week low even if it stays unchanged on a day.
- Market’s cautious mood ahead of FOMC joins pre-OPEC+ anxiety to restrict latest moves.
- Unimpressive China PMI recently weighed on Oil prices amid sluggish session.
- OPEC+ is expected to remain output cut policy unchanged, Fed’s dovish hike may propel commodity prices.
The pair currently trades last at 79.28.
The previous day high was 79.38 while the previous day low was 76.7. The daily 38.2% Fib levels comes at 78.36, expected to provide support. Similarly, the daily 61.8% fib level is at 77.72, expected to provide support.
WTI crude oil seesaws near $79.30 after taking a U-turn from the intraday low surrounding $79.50 as traders await the key Joint Ministerial Monitoring Committee (JMMC) meeting of the Organization of the Petroleum Exporting Countries (OPEC) and allies led by Russia, known collectively as OPEC+. Also challenging the momentum of the black gold price could be the cautious mood in the market as traders await the Federal Open Market Committee (FOMC) monetary policy announcements.
On Tuesday, headlines suggesting an increase in the US energy demand and the broad US Dollar weakness underpinned the quote’s recovery moves.
That said, the US Energy Information Administration (EIA) said Tuesday, in its Petroleum Supply Monthly (PSM) report, that demand for US crude and petroleum products rose 178,000 barrels per day (bpd) in November to 20.59 million bpd, the highest since August.
On the same line, Reuters released a survey on Tuesday suggesting that the OPEC oil output fell in January as Iraqi exports declined and Nigerian output did not recover further while Gulf members maintained strong compliance with an OPEC+ deal on production cuts to support the market.
It should be noted that the downbeat US data eased the inflation fears and backed the dovish hike expectations from the Federal Reserve (Fed), which in turn weighed on the US Dollar Index (DXY) and allowed the WTI crude oil the previous day. That said, US Employment Cost Index (ECI) for the fourth quarter (Q4) eased to 1.0% versus 1.1% market forecasts and 1.2% prior readings. Further, the Conference Board (CB) Consumer Confidence eased to 107.10 in January versus 108.3 prior. It should be noted that no major attention could be given to the US Chicago Purchasing Managers’ Index (PMI) for January which rose to 44.3 versus 41 expected and 44.9 previous readings.
Amid these plays, the S&P 500 Futures print mild losses while the US Treasury bond yields remain sluggish and pause the previous day’s pullback. That said, the US Dollar Index (DXY) remains inactive near 102.10 at the latest.
Moving on, the OPEC+ policy meeting will be important for the Oil traders even as no change is expected. “Five OPEC+ sources told Reuters last week that the JMMC would discuss the economic outlook and the scale of Chinese demand, and was unlikely to suggest tweaks to current policy,” said Reuters. The reason could be linked to the statement from Reuters suggesting OPEC+ agreed in October to cut its production target by 2 million barrels per day (bpd), about 2% of world demand, from November until the end of 2023.
Following that, the Fed’s verdict will be crucial as it will affect the black gold prices via the US Dollar moves. In that case, a dovish outcome could drag the greenback towards refreshing the yearly low.
Although the 50-DMA puts a floor under the WTI crude oil price at around $77.80, the bearish MACD signals and the steady RSI (14) keep sellers hopeful. The reason could be linked to the commodity’s sustained trading below the key hurdles.
Technical Levels: Supports and Resistances
XTIUSD currently trading at 79.28 at the time of writing. Pair opened at 79.23 and is trading with a change of 0.06% % .
| Overview | Overview.1 | |
|---|---|---|
| 0 | Today last price | 79.28 |
| 1 | Today Daily Change | 0.05 |
| 2 | Today Daily Change % | 0.06% |
| 3 | Today daily open | 79.23 |
The pair is trading above its 20 Daily moving average @ 78.54, above its 50 Daily moving average @ 77.76 , below its 100 Daily moving average @ 81.43 and below its 200 Daily moving average @ 91.19
| Trends | Trends.1 | |
|---|---|---|
| 0 | Daily SMA20 | 78.54 |
| 1 | Daily SMA50 | 77.76 |
| 2 | Daily SMA100 | 81.43 |
| 3 | Daily SMA200 | 91.19 |
The previous day high was 79.38 while the previous day low was 76.7. The daily 38.2% Fib levels comes at 78.36, expected to provide support. Similarly, the daily 61.8% fib level is at 77.72, expected to provide support.
Note the levels of interest below:
- Pivot support is noted at 77.49, 75.75, 74.8
- Pivot resistance is noted at 80.17, 81.12, 82.86
| Levels | Levels.1 |
|---|---|
| Previous Daily High | 79.38 |
| Previous Daily Low | 76.70 |
| Previous Weekly High | 82.68 |
| Previous Weekly Low | 79.15 |
| Previous Monthly High | 82.68 |
| Previous Monthly Low | 72.64 |
| Daily Fibonacci 38.2% | 78.36 |
| Daily Fibonacci 61.8% | 77.72 |
| Daily Pivot Point S1 | 77.49 |
| Daily Pivot Point S2 | 75.75 |
| Daily Pivot Point S3 | 74.80 |
| Daily Pivot Point R1 | 80.17 |
| Daily Pivot Point R2 | 81.12 |
| Daily Pivot Point R3 | 82.86 |
[/s2If]
Join Our Telegram Group


