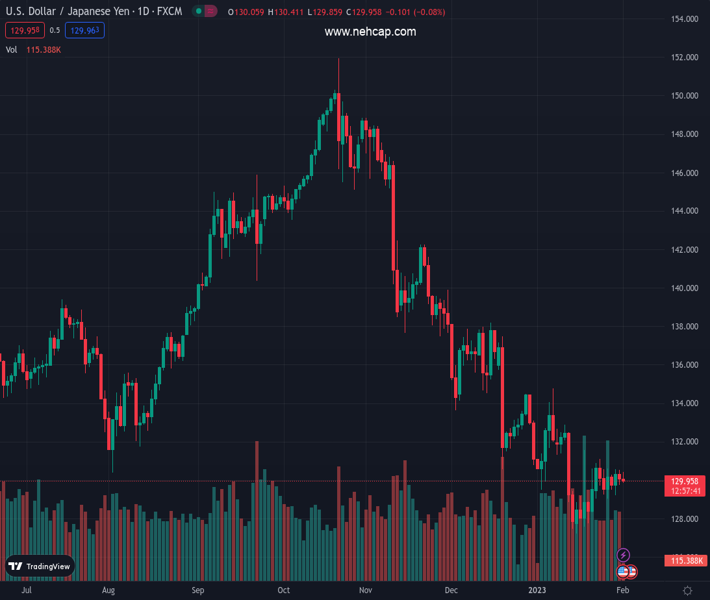
#USDJPY @ 129.945 extends its sideways consolidative price move and remains below the mid-130.00s. (Pivot Orderbook analysis)
…
This is a premium post.
[s2If !current_user_can(access_s2member_level4)]Please register for PREMIUM VERSION HERE to read full post below containing analysis. In case of any error or you think you are not able to read the full post below, please email us at support#nehcap.com [lwa][/s2If] [s2If current_user_can(access_s2member_level4)]
- USD/JPY extends its sideways consolidative price move and remains below the mid-130.00s.
- Bets for smaller rate hikes by the Fed weigh on the USD and act as a headwind for the pair.
- The cautious market mood underpins the JPY and further contributes to capping the upside.
The pair currently trades last at 129.945.
The previous day high was 130.53 while the previous day low was 129.74. The daily 38.2% Fib levels comes at 130.04, expected to provide resistance. Similarly, the daily 61.8% fib level is at 130.23, expected to provide resistance.
The USD/JPY pair struggles to gain any meaningful traction and seesaws between tepid gains/minor losses through the early part of the European session on Wednesday. Spot prices remain below the mid-130.00s as traders seem reluctant and keenly await the outcome of a two-day FOMC monetary policy meeting.
The Fed will announce its decision later during the US session and is widely expected to moderate the pace of its rate-hiking cycle amid signs of easing inflationary pressures. The bets were reaffirmed by the US wage growth data released on Tuesday, which showed that labor costs increased less than expected in the fourth quarter. This, in turn, is seen dragging the US Treasury bond yields lower and weighing on the US Dollar, which, in turn, acts as a headwind for the USD/JPY pair.
Investors, meanwhile, turn cautious heading into the key central bank event risk. This is evident from the prevalent cautious mood around the equity markets and lends support to the safe-haven Japanese Yen (JPY). Apart from this, speculation that high inflation may invite a more hawkish stance from the Bank of Japan (BoJ) later this year underpins the JPY. The fundamental backdrop favours bearish traders and suggests that the path of least resistance for the USD/JPY pair is to the downside.
Even from a technical perspective, the recent price action witnessed over the past two weeks or so constitutes the formation of a symmetrical triangle. Against the backdrop of a sharp corrective fall from over a three-decade top, the said triangle could be categorized as a bearish pennant and validates the negative outlook for the USD/JPY pair. Hence, any attempted recovery move might still be seen as a selling opportunity and runs the risk of fizzling out rather quickly.
Market participants now look forward to the US economic docket, featuring the release of the ADP report on private-sector employment, ISM Manufacturing PMI and JOLTS Job Openings data. This, along with the US bond yields, might influence the USD price dynamics and provide some impetus to the USD/JPY pair. Apart from this, traders will take cues from the broader market risk sentiment to grab short-term opportunities ahead of the highly-anticipated FOMC policy decision.
Technical Levels: Supports and Resistances
USDJPY currently trading at 130.1 at the time of writing. Pair opened at 130.14 and is trading with a change of -0.03 % .
| Overview | Overview.1 | |
|---|---|---|
| 0 | Today last price | 130.10 |
| 1 | Today Daily Change | -0.04 |
| 2 | Today Daily Change % | -0.03 |
| 3 | Today daily open | 130.14 |
The pair remains strongly bearish on the daily time frame. It trades below the 20 SMA @ 130.33, 50 SMA 133.38, 100 SMA @ 139.19 and 200 SMA @ 136.79.
| Trends | Trends.1 | |
|---|---|---|
| 0 | Daily SMA20 | 130.33 |
| 1 | Daily SMA50 | 133.38 |
| 2 | Daily SMA100 | 139.19 |
| 3 | Daily SMA200 | 136.79 |
The previous day high was 130.53 while the previous day low was 129.74. The daily 38.2% Fib levels comes at 130.04, expected to provide resistance. Similarly, the daily 61.8% fib level is at 130.23, expected to provide resistance.
Note the levels of interest below:
- Pivot support is noted at 129.74, 129.35, 128.95
- Pivot resistance is noted at 130.53, 130.93, 131.32
| Levels | Levels.1 |
|---|---|
| Previous Daily High | 130.53 |
| Previous Daily Low | 129.74 |
| Previous Weekly High | 131.12 |
| Previous Weekly Low | 129.02 |
| Previous Monthly High | 134.78 |
| Previous Monthly Low | 127.22 |
| Daily Fibonacci 38.2% | 130.04 |
| Daily Fibonacci 61.8% | 130.23 |
| Daily Pivot Point S1 | 129.74 |
| Daily Pivot Point S2 | 129.35 |
| Daily Pivot Point S3 | 128.95 |
| Daily Pivot Point R1 | 130.53 |
| Daily Pivot Point R2 | 130.93 |
| Daily Pivot Point R3 | 131.32 |
[/s2If]
Join Our Telegram Group


