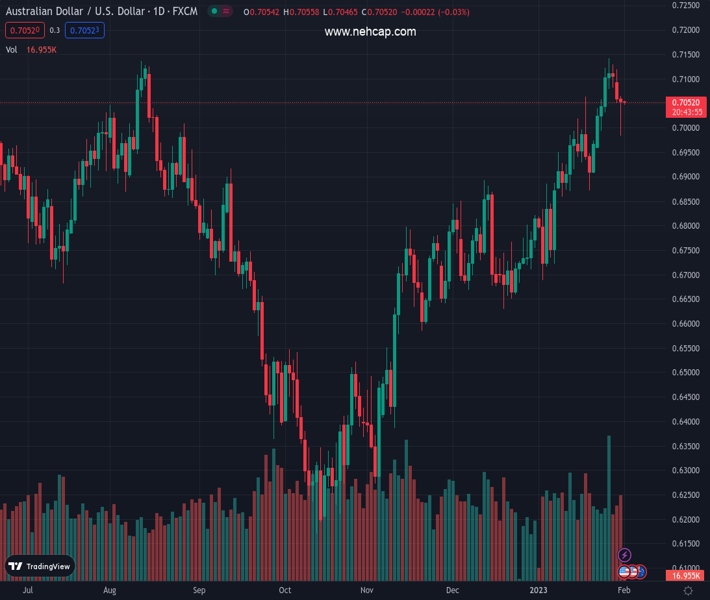
#AUDUSD @ 0.70520 fades the previous day’s rebound from one-week low, sidelined of late. (Pivot Orderbook analysis)
…
This is a premium post.
[s2If !current_user_can(access_s2member_level4)]Please register for PREMIUM VERSION HERE to read full post below containing analysis. In case of any error or you think you are not able to read the full post below, please email us at support#nehcap.com [lwa][/s2If] [s2If current_user_can(access_s2member_level4)]
- AUD/USD fades the previous day’s rebound from one-week low, sidelined of late.
- RBA’s Kohler conveys dovish bias by signalling peak of Aussie inflation in Q4 2022.
- Downbeat US data, yields favored Aussie pair buyers but cautious mood ahead of Fed probe recovery moves.
- As 0.25% rate hike is already given, Fed Chairman Jerome Powell’s press conference will be crucial to watch.
The pair currently trades last at 0.70520.
The previous day high was 0.7066 while the previous day low was 0.6984. The daily 38.2% Fib levels comes at 0.7034, expected to provide support. Similarly, the daily 61.8% fib level is at 0.7015, expected to provide support.
AUD/USD pares the previous day’s recovery from the weekly bottom as it eases to 0.7050 during early Wednesday. The Aussie pair’s latest weakness could be linked to the cautious mood ahead of the Federal Reserve’s (Fed) key monetary policy meeting and downbeat comments from the Reserve Bank of Australia (RBA) policymaker.
Recently, RBA’s Head of the Economic Analysis Department Marion Kohler mentioned that the bank believes inflation peaked in Q4 of 2022. Earlier in the day, Australia’s S&P Global Manufacturing PMI rose to 50.0 for January versus 49.8 market forecasts and prior.
On the other hand, the S&P 500 Futures print mild losses by the press time while the US Treasury bond yields also struggle for clear directions as market sentiment dwindles ahead of the Fed’s verdict, amid dovish hike expectations.
It’s worth noting that the US Dollar Index (DXY) printed the first daily loss in four on Tuesday amid downbeat US data and Treasury bond yields, staying defensive near 102.00 by the press time.
That said, the US Employment Cost Index (ECI) for the fourth quarter (Q4) eased to 1.0% versus 1.1% market forecasts and 1.2% prior readings. Further, the Conference Board (CB) Consumer Confidence eased to 107.10 in January versus 108.3 prior. It should be noted that no major attention could be given to the US Chicago Purchasing Managers’ Index (PMI) for January which rose to 44.3 versus 41 expected and 44.9 previous readings.
In addition to the mostly downbeat US data, firmer earnings data from the industry majors like General Motors, Exxon and McDonalds pushed back recession woes and propelled the Wall Street benchmarks, which in turn weighed on the US Treasury bond yields and the DXY. That said, the Dow Jones Industrial Average (DJIA), S&P 500 and Nasdaq all three reported over 1.0% daily gains the previous day.
Amid these plays, the US 10-year Treasury bond yields snapped a three-day uptrend while revisiting 3.51% while the two-year counterpart also dropped to 4.20%, pressured near the same levels by the press time.
Looking forward, AUD/USD traders should pay attention to China Caixin Manufacturing PMI for immediate directions but major attention will be given to the Fed’s ability to defy dovish expectations and the DXY bears readiness to retake control.
Tuesday’s Dragonfly Doji candlestick and the 10-DMA, around 0.7045 by the press time, challenge AUD/USD sellers.
Technical Levels: Supports and Resistances
AUDUSD currently trading at 0.7048 at the time of writing. Pair opened at 0.7059 and is trading with a change of -0.16% % .
| Overview | Overview.1 | |
|---|---|---|
| 0 | Today last price | 0.7048 |
| 1 | Today Daily Change | -0.0011 |
| 2 | Today Daily Change % | -0.16% |
| 3 | Today daily open | 0.7059 |
The pair remains strongly bullish on the daily timeframe. It trades above its 20 SMA @ 0.697, 50 SMA 0.6834, 100 SMA @ 0.6661 and 200 SMA @ 0.6811.
| Trends | Trends.1 | |
|---|---|---|
| 0 | Daily SMA20 | 0.6970 |
| 1 | Daily SMA50 | 0.6834 |
| 2 | Daily SMA100 | 0.6661 |
| 3 | Daily SMA200 | 0.6811 |
The previous day high was 0.7066 while the previous day low was 0.6984. The daily 38.2% Fib levels comes at 0.7034, expected to provide support. Similarly, the daily 61.8% fib level is at 0.7015, expected to provide support.
Note the levels of interest below:
- Pivot support is noted at 0.7007, 0.6954, 0.6925
- Pivot resistance is noted at 0.7088, 0.7118, 0.717
| Levels | Levels.1 |
|---|---|
| Previous Daily High | 0.7066 |
| Previous Daily Low | 0.6984 |
| Previous Weekly High | 0.7143 |
| Previous Weekly Low | 0.6960 |
| Previous Monthly High | 0.7143 |
| Previous Monthly Low | 0.6688 |
| Daily Fibonacci 38.2% | 0.7034 |
| Daily Fibonacci 61.8% | 0.7015 |
| Daily Pivot Point S1 | 0.7007 |
| Daily Pivot Point S2 | 0.6954 |
| Daily Pivot Point S3 | 0.6925 |
| Daily Pivot Point R1 | 0.7088 |
| Daily Pivot Point R2 | 0.7118 |
| Daily Pivot Point R3 | 0.7170 |
[/s2If]
Join Our Telegram Group


