WTI crude oil remains pressured around intraday low as it snap two-day uptrend. (Pivot Orderbook analysis)
…
This is a premium post.
[s2If !current_user_can(access_s2member_level4)]Please register for PREMIUM VERSION HERE to read full post below containing analysis. In case of any error or you think you are not able to read the full post below, please email us at support#nehcap.com [lwa][/s2If] [s2If current_user_can(access_s2member_level4)]
- WTI crude oil remains pressured around intraday low as it snap two-day uptrend.
- Oil markets consolidate recent gains amid China holidays, pre-Fed blackout.
- G7 pushes back review of the Oil price cap on Russian exports.
- Preliminary PMIs for January, US Advances GDP for Q4 will be crucial for fresh impulse.
The pair currently trades last at 81.34.
The previous day high was 81.93 while the previous day low was 79.94. The daily 38.2% Fib levels comes at 81.17, expected to provide support. Similarly, the daily 61.8% fib level is at 80.7, expected to provide support.
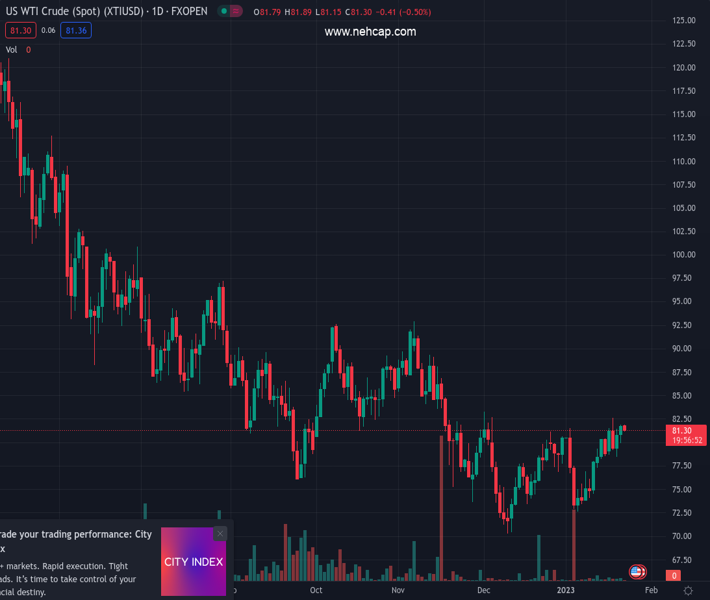
WTI crude oil fades upside momentum after a two-week uptrend, down 0.65% intraday near $81.30 during early Monday, as the market’s inaction allows energy traders to pare some gains. In doing so, the black gold traders fail to cheer the softer US Dollar, as well as fears of more geopolitical tension surrounding Russian exports.
“Group of Seven (G7) officials have agreed to review the level of the price cap on exports of Russian oil in March, later than originally planned in order to give time to assess the market after more caps are placed on oil products from Russia, the U.S. Treasury said on Friday,” reported Reuters.
On the other hand, the US Dollar Index (DXY) drops for the third consecutive day as traders prepare for the next week’s Federal Open Market Committee (FOMC) monetary policy meeting amid hopes of softer rate hikes preceding the policy pivot.
That said, the latest comments from the US Federal Reserve (Fed) officials, ahead of a two-week ‘blackout period’ before the Fed meeting, favored further rate hikes and highlighted inflation fears. However, the downbeat US data and easing inflation woes underpinned the market’s expectations of softer rate hikes from the Fed, as well as the nearness to the policy pivot, which in turn weighed on the DXY.
Elsewhere, China’s one-week off due to the Lunar New Year holidays also seems to challenge the Oil buyers as the energy benchmark’s previous rally took major clues from Beijing’s reopening.
It should be noted that the market’s mixed concerns seem to challenge the Oil buyers amid a lack of major moves and the absence of Chinese traders. However, optimism surrounding the dragon nation and the dovish bias from the Fed seems to put a floor under the commodity prices.
The latest pullback portrays the WTI’s inability to cross the 100-DMA hurdle, around $81.80 by the press time. However, bullish MACD signals and firmer RSI, not overbought, joins the quote’s sustained trading beyond the 50-DMA support of $78.05 to keep the Oil buyers hopeful.
Technical Levels: Supports and Resistances
XTIUSD currently trading at 81.34 at the time of writing. Pair opened at 81.87 and is trading with a change of -0.65% % .
| Overview | Overview.1 | |
|---|---|---|
| 0 | Today last price | 81.34 |
| 1 | Today Daily Change | -0.53 |
| 2 | Today Daily Change % | -0.65% |
| 3 | Today daily open | 81.87 |
The pair is trading above its 20 Daily moving average @ 78.26, above its 50 Daily moving average @ 78.12 , below its 100 Daily moving average @ 81.83 and below its 200 Daily moving average @ 91.97
| Trends | Trends.1 | |
|---|---|---|
| 0 | Daily SMA20 | 78.26 |
| 1 | Daily SMA50 | 78.12 |
| 2 | Daily SMA100 | 81.83 |
| 3 | Daily SMA200 | 91.97 |
The previous day high was 81.93 while the previous day low was 79.94. The daily 38.2% Fib levels comes at 81.17, expected to provide support. Similarly, the daily 61.8% fib level is at 80.7, expected to provide support.
Note the levels of interest below:
- Pivot support is noted at 80.57, 79.26, 78.58
- Pivot resistance is noted at 82.55, 83.24, 84.54
| Levels | Levels.1 |
|---|---|
| Previous Daily High | 81.93 |
| Previous Daily Low | 79.94 |
| Previous Weekly High | 82.67 |
| Previous Weekly Low | 78.48 |
| Previous Monthly High | 83.30 |
| Previous Monthly Low | 70.27 |
| Daily Fibonacci 38.2% | 81.17 |
| Daily Fibonacci 61.8% | 80.70 |
| Daily Pivot Point S1 | 80.57 |
| Daily Pivot Point S2 | 79.26 |
| Daily Pivot Point S3 | 78.58 |
| Daily Pivot Point R1 | 82.55 |
| Daily Pivot Point R2 | 83.24 |
| Daily Pivot Point R3 | 84.54 |
[/s2If]
Join Our Telegram Group
")


