#GBPUSD @ 1.24172 pares intraday gains after refreshing multi-day top., @nehcap view: Limited upside expected (Pivot Orderbook analysis)
…
This is a premium post.
[s2If !current_user_can(access_s2member_level4)]Please register for PREMIUM VERSION HERE to read full post below containing analysis. In case of any error or you think you are not able to read the full post below, please email us at support#nehcap.com [lwa][/s2If] [s2If current_user_can(access_s2member_level4)]
- GBP/USD pares intraday gains after refreshing multi-day top.
- Overbought RSI, six-week-old horizontal hurdle challenge Cable buyers.
- 21-SMA adds strength to 1.2365 key support, successful break of 1.2530 will defy rising wedge formation.
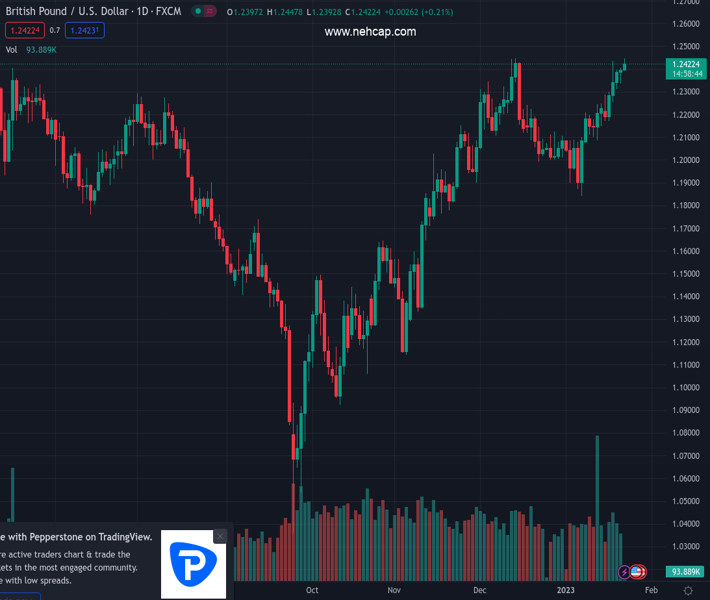
The pair currently trades last at 1.24172.
The previous day high was 1.2404 while the previous day low was 1.2335. The daily 38.2% Fib levels comes at 1.2378, expected to provide support. Similarly, the daily 61.8% fib level is at 1.2362, expected to provide support.
GBP/USD struggles to defend the 1.2400 threshold during a five-day uptrend to Monday’s European session, after rising to the highest levels since June 2022 earlier in the day.
In doing so, the Cable pair eases from the six-week-old horizontal resistance surrounding 1.2450 as the RSI (14) hits the overbought territory.
In addition to the quote’s repeated failures to cross the 1.2450 hurdle and the overbought RSI conditions, a 13-day-old rising wedge bearish chart formation also teases the GBP/USD bears around the multi-day top.
However, the 21-SMA level adds strength to the 1.2365 support, a break of which will confirm the rising wedge bearish pattern.
Following that, the 1.2100 and the 1.2000 round figures may entertain the GBP/USD bears during the theoretical south-run targeting the 1.1800 levels.
It should be noted that the sluggish MACD signals challenge the pair’s intraday momentum and hence restrict the bear’s entry.
On the contrary, successful trading beyond the 1.2450 hurdle isn’t an open invitation to the GBP/USD bulls as the stated wedge’s top line, near 1. 2530 by the press time, will act as an additional upside filter for the pair.
In a case where the GBP/USD remains firmer past 1.2530, a run-up towards May 2022 high near 1.2665 can’t be ruled out.
Trend: Limited upside expected
Technical Levels: Supports and Resistances
GBPUSD currently trading at 1.2413 at the time of writing. Pair opened at 1.2395 and is trading with a change of 0.15% % .
| Overview | Overview.1 | |
|---|---|---|
| 0 | Today last price | 1.2413 |
| 1 | Today Daily Change | 0.0018 |
| 2 | Today Daily Change % | 0.15% |
| 3 | Today daily open | 1.2395 |
The pair remains strongly bullish on the daily timeframe. It trades above its 20 SMA @ 1.2143, 50 SMA 1.211, 100 SMA @ 1.1724 and 200 SMA @ 1.1978.
| Trends | Trends.1 | |
|---|---|---|
| 0 | Daily SMA20 | 1.2143 |
| 1 | Daily SMA50 | 1.2110 |
| 2 | Daily SMA100 | 1.1724 |
| 3 | Daily SMA200 | 1.1978 |
The previous day high was 1.2404 while the previous day low was 1.2335. The daily 38.2% Fib levels comes at 1.2378, expected to provide support. Similarly, the daily 61.8% fib level is at 1.2362, expected to provide support.
Note the levels of interest below:
- Pivot support is noted at 1.2352, 1.2309, 1.2283
- Pivot resistance is noted at 1.2421, 1.2447, 1.249
| Levels | Levels.1 |
|---|---|
| Previous Daily High | 1.2404 |
| Previous Daily Low | 1.2335 |
| Previous Weekly High | 1.2436 |
| Previous Weekly Low | 1.2169 |
| Previous Monthly High | 1.2447 |
| Previous Monthly Low | 1.1992 |
| Daily Fibonacci 38.2% | 1.2378 |
| Daily Fibonacci 61.8% | 1.2362 |
| Daily Pivot Point S1 | 1.2352 |
| Daily Pivot Point S2 | 1.2309 |
| Daily Pivot Point S3 | 1.2283 |
| Daily Pivot Point R1 | 1.2421 |
| Daily Pivot Point R2 | 1.2447 |
| Daily Pivot Point R3 | 1.2490 |
[/s2If]
Join Our Telegram Group
")


