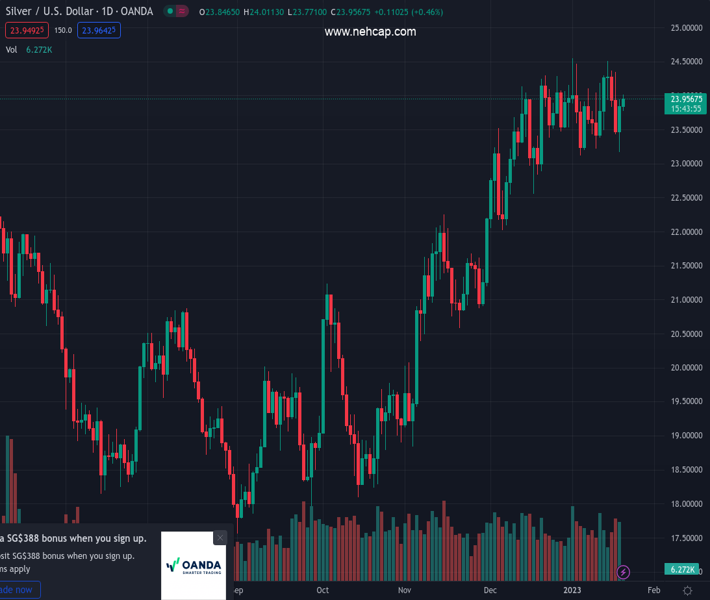
#XAGUSD @ 23.942 Silver edges higher on Friday, albeit lacks follow-through beyond the $24.00 mark. (Pivot Orderbook analysis)
…
This is a premium post.
[s2If !current_user_can(access_s2member_level4)]Please register for PREMIUM VERSION HERE to read full post below containing analysis. In case of any error or you think you are not able to read the full post below, please email us at support#nehcap.com [lwa][/s2If] [s2If current_user_can(access_s2member_level4)]
- Silver edges higher on Friday, albeit lacks follow-through beyond the $24.00 mark.
- The technical setup favours bullish traders and supports prospects for further gains.
- A convincing break below the trend-channel support will negate the positive outlook.
The pair currently trades last at 23.942.
The previous day high was 23.94 while the previous day low was 23.17. The daily 38.2% Fib levels comes at 23.65, expected to provide support. Similarly, the daily 61.8% fib level is at 23.46, expected to provide support.
Silver builds on the previous day’s goodish rebound from the $23.15 area, or a two-week low and edges higher during the Asian session on Friday. The white metal, however, struggles to find acceptance or extend the momentum beyond the $24.00 mark and has now trimmed a part of its modest intraday gains.
From a technical perspective, the XAG/USD on Thursday managed to defend support marked by the lower end of over a one-one-month-old ascending channel. The subsequent move-up suggests that this week’s pullback from the $24.50 resistance zone has run its course. Moreover, oscillators on the daily chart just manage to hold in the bullish territory and have again started gaining positive traction on hourly charts.
The aforementioned technical setup supports prospects for a further appreciating move, though the lack of follow-through buying warrants some caution for aggressive bullish traders. Nevertheless, the XAG/USD still seems poised to retest the multi-month peak, around the $24.50 area, before eventually aiming to challenge the trend-channel resistance. The latter is currently pegged just ahead of the $25.00 psychological mark.
On the flip side, the 200-period SMA on the 4-hour chart, around the $23.55 region, seems to protect the immediate downside. This is closely followed by the trend-channel support, near the $23.40-$23.35 zone and the overnight swing low, around the $23.15 area. A convincing break below the said support levels will be seen as a fresh trigger for bearish traders and make the XAG/USD vulnerable to weaken below the $23.00 mark.
The next relevant support is pegged near the $22.60-$22.55 region before the XAG/USD eventually drops to the $22.10-$22.00 zone. The latter represents a static resistance breakpoint and might help limit any further losses, at least for the time being.
Technical Levels: Supports and Resistances
XAGUSD currently trading at 23.91 at the time of writing. Pair opened at 23.86 and is trading with a change of 0.21 % .
| Overview | Overview.1 | |
|---|---|---|
| 0 | Today last price | 23.91 |
| 1 | Today Daily Change | 0.05 |
| 2 | Today Daily Change % | 0.21 |
| 3 | Today daily open | 23.86 |
The pair remains strongly bullish on the daily timeframe. It trades above its 20 SMA @ 23.79, 50 SMA 22.93, 100 SMA @ 21.17 and 200 SMA @ 21.05.
| Trends | Trends.1 | |
|---|---|---|
| 0 | Daily SMA20 | 23.79 |
| 1 | Daily SMA50 | 22.93 |
| 2 | Daily SMA100 | 21.17 |
| 3 | Daily SMA200 | 21.05 |
The previous day high was 23.94 while the previous day low was 23.17. The daily 38.2% Fib levels comes at 23.65, expected to provide support. Similarly, the daily 61.8% fib level is at 23.46, expected to provide support.
Note the levels of interest below:
- Pivot support is noted at 23.37, 22.89, 22.6
- Pivot resistance is noted at 24.15, 24.43, 24.92
| Levels | Levels.1 |
|---|---|
| Previous Daily High | 23.94 |
| Previous Daily Low | 23.17 |
| Previous Weekly High | 24.30 |
| Previous Weekly Low | 23.22 |
| Previous Monthly High | 24.30 |
| Previous Monthly Low | 22.03 |
| Daily Fibonacci 38.2% | 23.65 |
| Daily Fibonacci 61.8% | 23.46 |
| Daily Pivot Point S1 | 23.37 |
| Daily Pivot Point S2 | 22.89 |
| Daily Pivot Point S3 | 22.60 |
| Daily Pivot Point R1 | 24.15 |
| Daily Pivot Point R2 | 24.43 |
| Daily Pivot Point R3 | 24.92 |
[/s2If]
Join Our Telegram Group
")


